
Welcome to FastLocations.ai. This platform combines powerful real estate and demographic data with direct access to the actual experts who know each region best.
Think of the app as walking into a convention center filled with Economic Developers. As you move from one booth to another, the person you're speaking with changes. When you select a specific Economic Developer, the Assistant automatically updates to "become" that person's digital aide — loaded with their specific knowledge, incentive programs, and regional data.
Real Data, Real Experts
Every AI assistant in FastLocations is trained on a specific Economic Developer's actual resources — not generic information.
Context-Aware Intelligence
The assistant automatically shifts its knowledge base when you select a new region or economic development agency.
Before you engage the Assistant, you need to set your target area. The map is built in layers — each one revealing a different dimension of a location's profile.
Workforce
Industry clusters & labour supply
Education
Schools & post-secondary access
Population
Demographics & growth trends
Utilities
Power, water & broadband
Transportation
Highways, rail & ports
Directory
Comprehensive corporate Listings
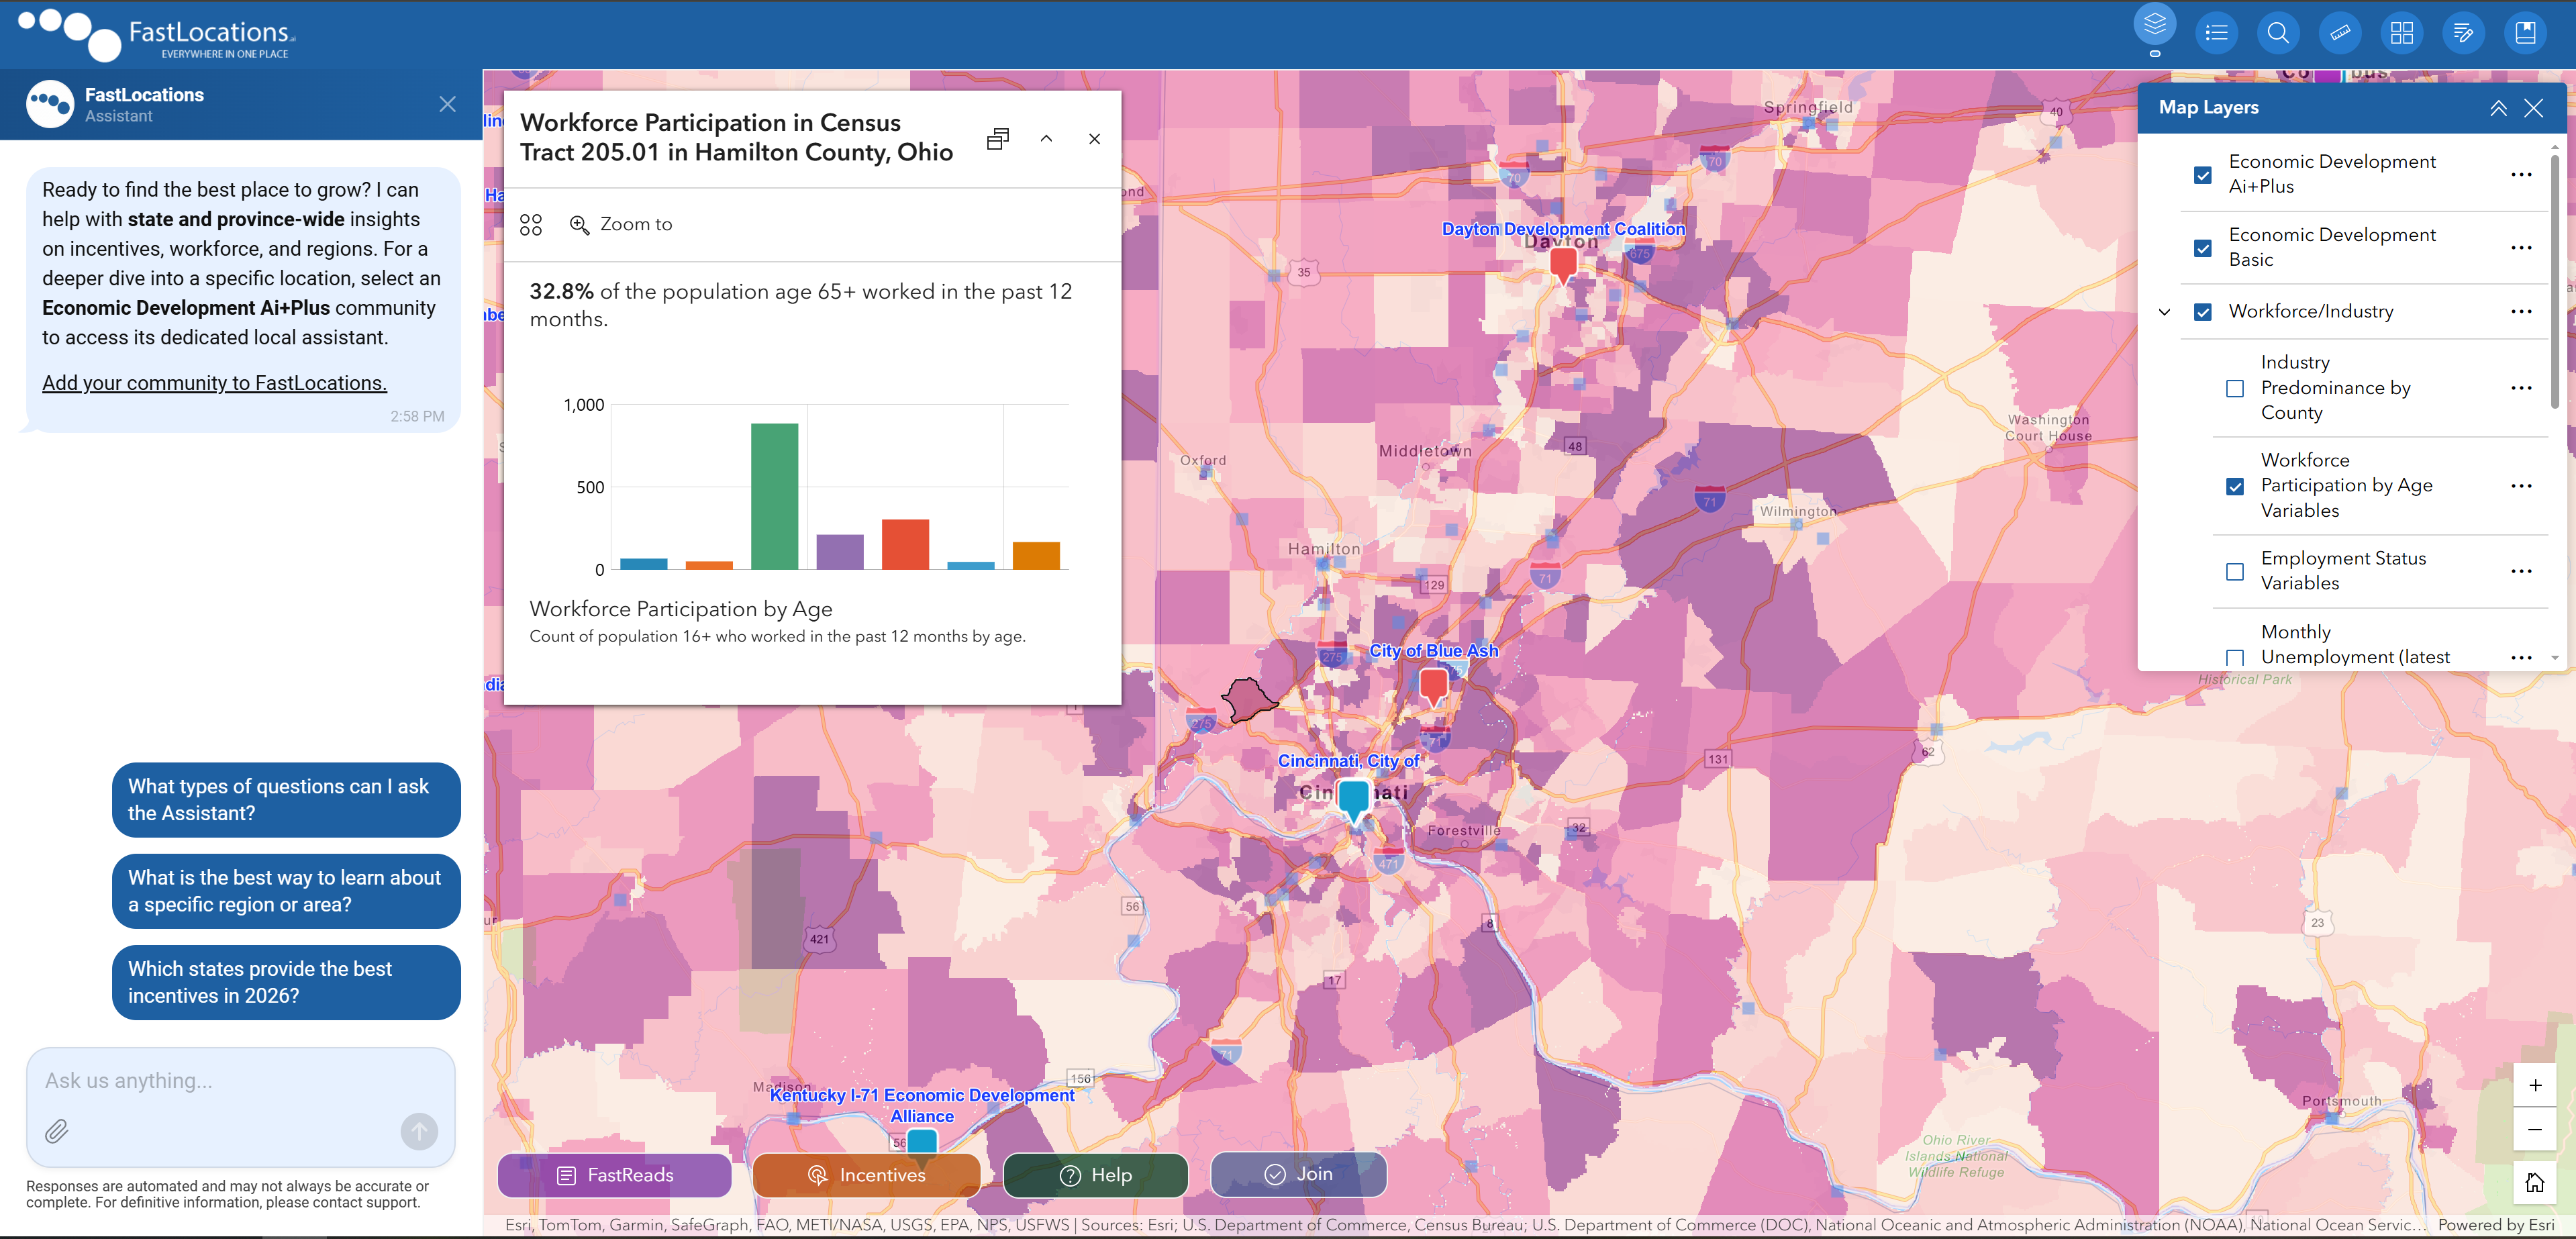
Pro tip: Use the Location Search in the top right corner to quickly filter the types of Economic Development +Plus Agencies you want to view.
The Magic layer — Economic Development Agencies +Plus — overlays the map with Local, Regional, State, and Utility Economic Developers as interactive icons. Clicking one activates that developer's AI assistant.
The Assistant is context-aware. By default, the FastLocations Assistant is docked on the left side of the screen (desktop) or at the bottom on mobile. It can help with general economic development queries or guide you around the platform.
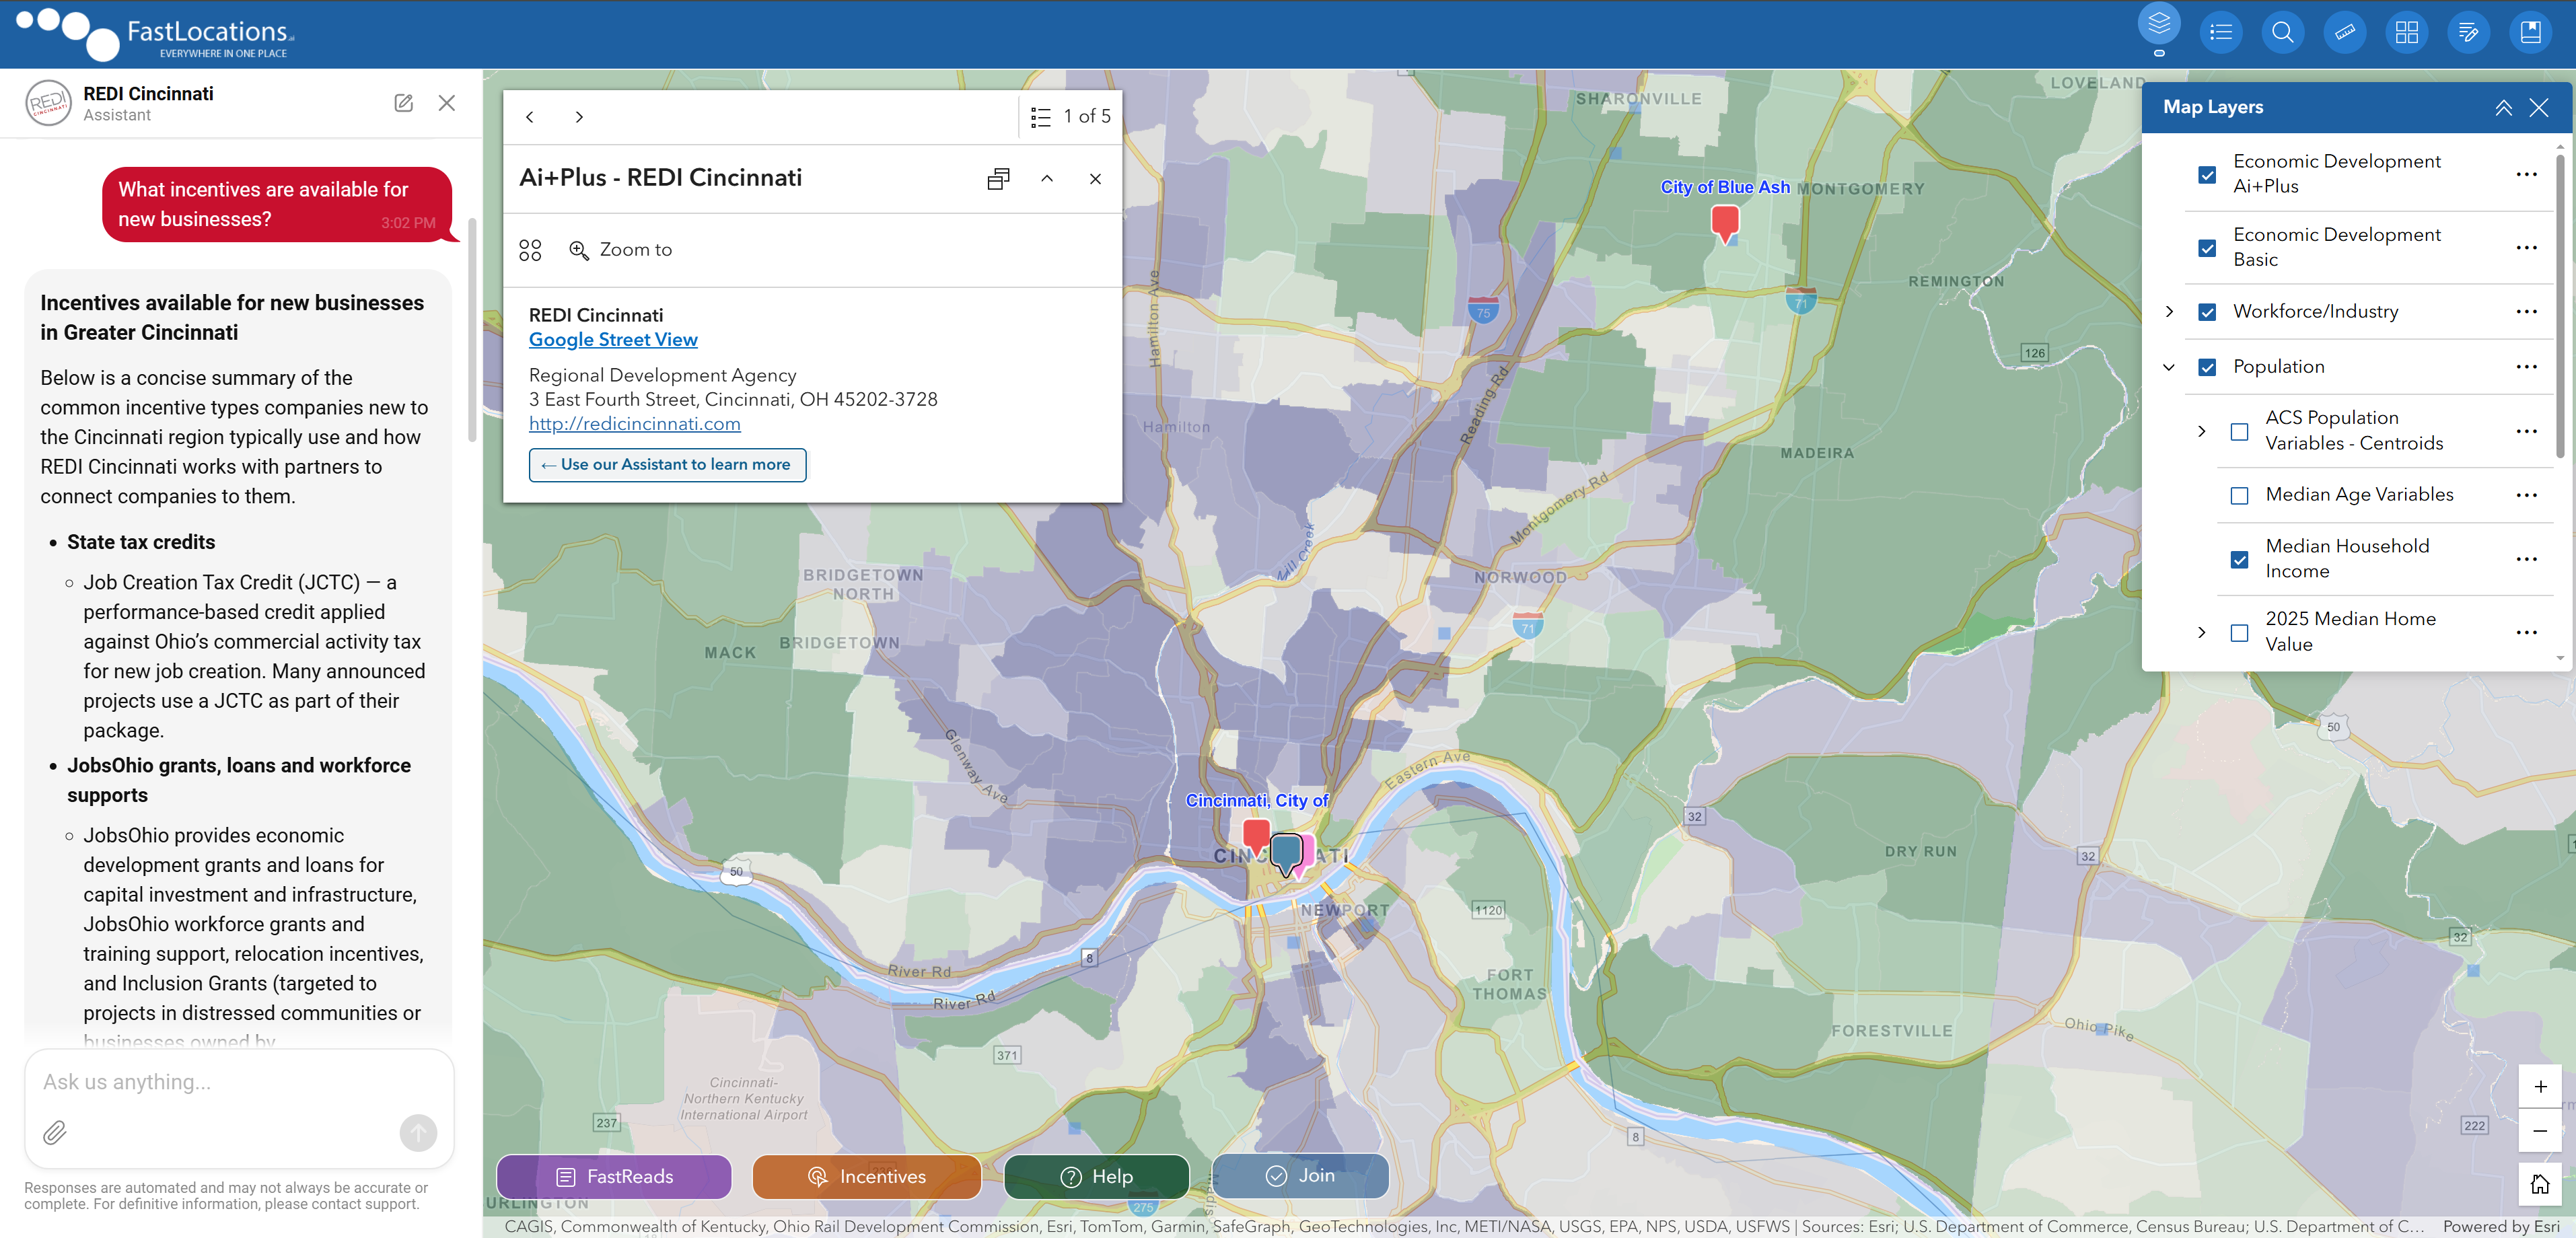
Click an Economic Development Agency +Plus
Tap any Economic Developer icon from the +Plus layer on the map. Each icon represents a distinct agency with its own knowledge base.
Watch the handoff
The chatbot panel updates to who you now want to speak with — for example, "REDI Cincinnati Economic Development Assistant."
Ask anything about that region
The Assistant instantly has access to that developer's specific knowledge — no need to provide background context.
Once an expert is selected, the knowledge base becomes available to the Assistant. Ask us anything:
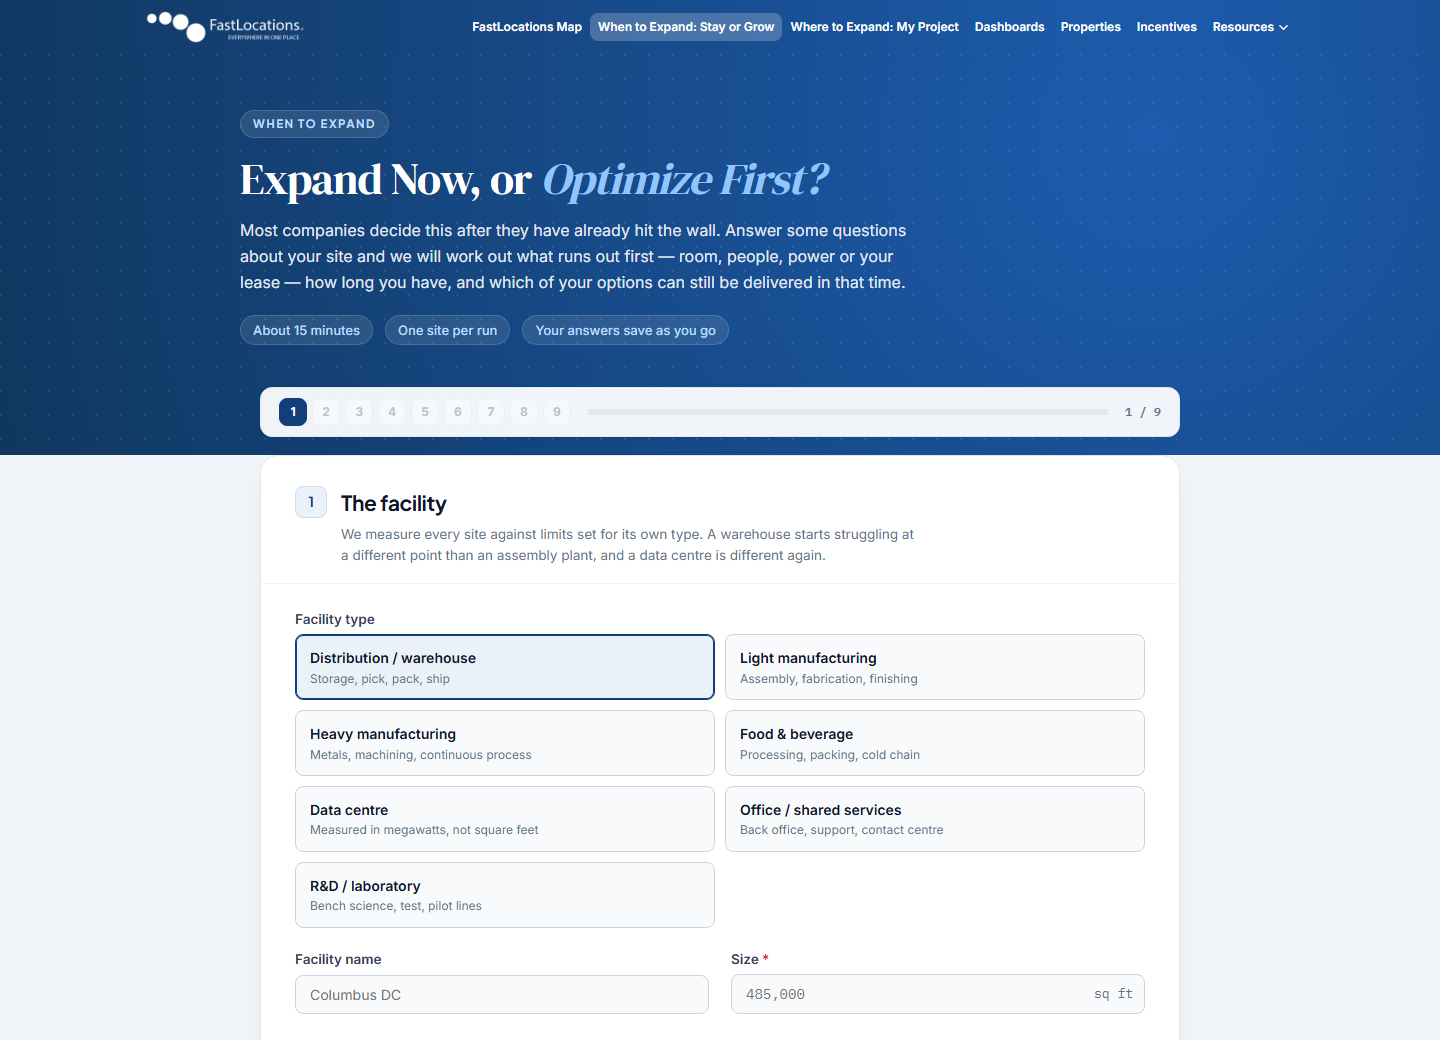
Most companies make this decision after they have already hit the wall. Stay or Grow asks it earlier. You answer a series of questions about one existing site, and the diagnostic works out what runs out first — room, people, power, water, docks or your lease — how long you have, and which of your options can still be delivered inside that window.
It takes about 15 minutes, covers one site per run, and your answers save as you go.
The six runways
Every constraint is measured against limits set for your own facility type — a warehouse starts struggling at a different point than an assembly plant, and a data center is different again. Each runway is reported in months, and the shortest one is the constraint that binds.
Room
Utilization against a practical ceiling, read at peak
People
Headcount required versus what you can realistically hire
Power
Deliverable load, not rated headroom — the queue counts
Water
Supply and discharge against process demand
Docks & Yard
Door-hours and trailer parking, scored separately
Lease
Term remaining, and when the renewal decision lands
A verdict, not a brochure
The verdict and the runways rest on arithmetic applied to your own figures — nothing else. A site that has room is told it has room. A seasonal squeeze is reported as a seasonal problem, not a building problem.
Show the working
Every runway carries a Show the working panel with the formula, the inputs, and the precise technical phrasing — so the same report serves the plant manager and the board packet.
Options you can actually deliver
Adding a shift, overflow space, expanding in place, a lease, a build-to-suit or a greenfield — each is assessed against your delivery window, with entitlement and utility interconnect lead times applied where they genuinely bite.
Does the location still suit you?
Ten factors — transport access, skilled labor, labor and operating costs, incentives, stability, supplier and customer proximity, water and sewer, infrastructure — rated fine, workable, or a problem. This never changes the verdict; it answers whether more of the same place would help.
The AI outlook is reported separately. Stay or Grow estimates how AI adoption may affect your headcount need and shows it as a second labor runway — but it never moves the verdict, the binding constraint, or the headline runway. AI also does not add floor space, electrical capacity, or lease term.
What you get back is a full report: the binding constraint and how many months of runway you have, a runway table across all six constraints, the options assessed with the engine's own reasoning, key dates, and matched suggested reading. From there you can build a draft Strategic Expansion Plan as a Word document, and — when the answer points somewhere other than this site — hand the whole thing straight to My Project.
Pro tip: Run Stay or Grow before you talk to any economic developer. Walking into that conversation knowing what binds first and by when turns a general enquiry into a specific, answerable one.
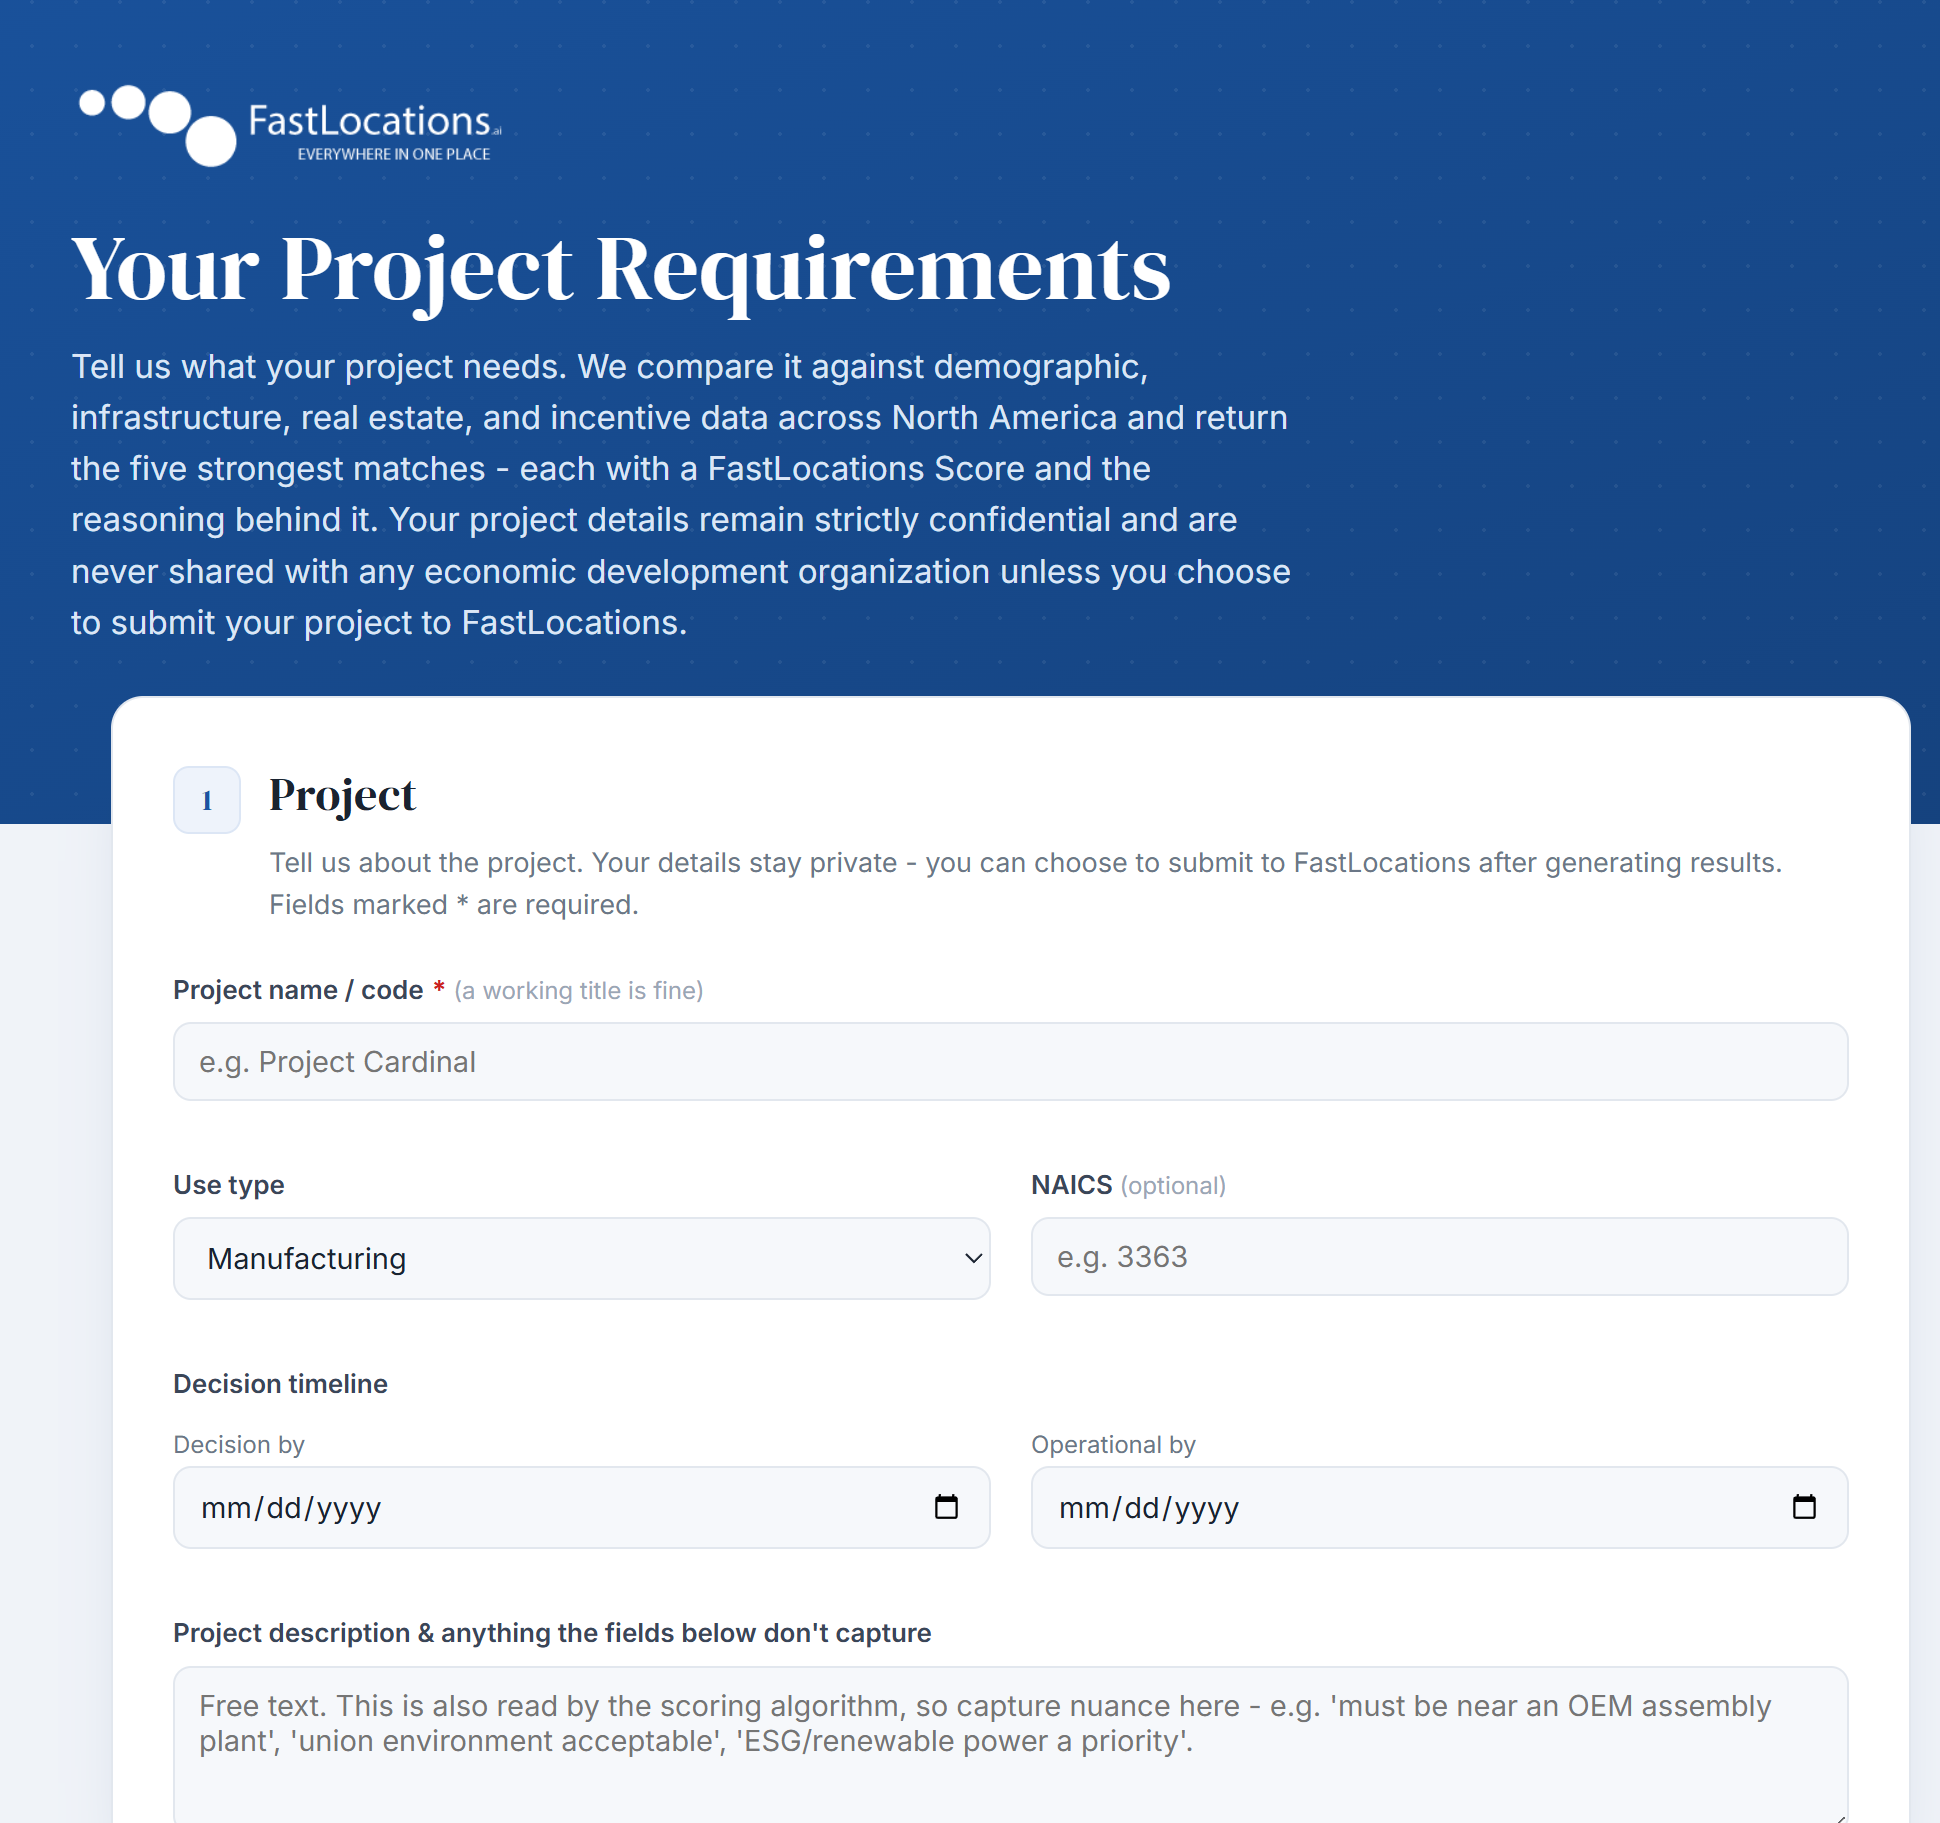
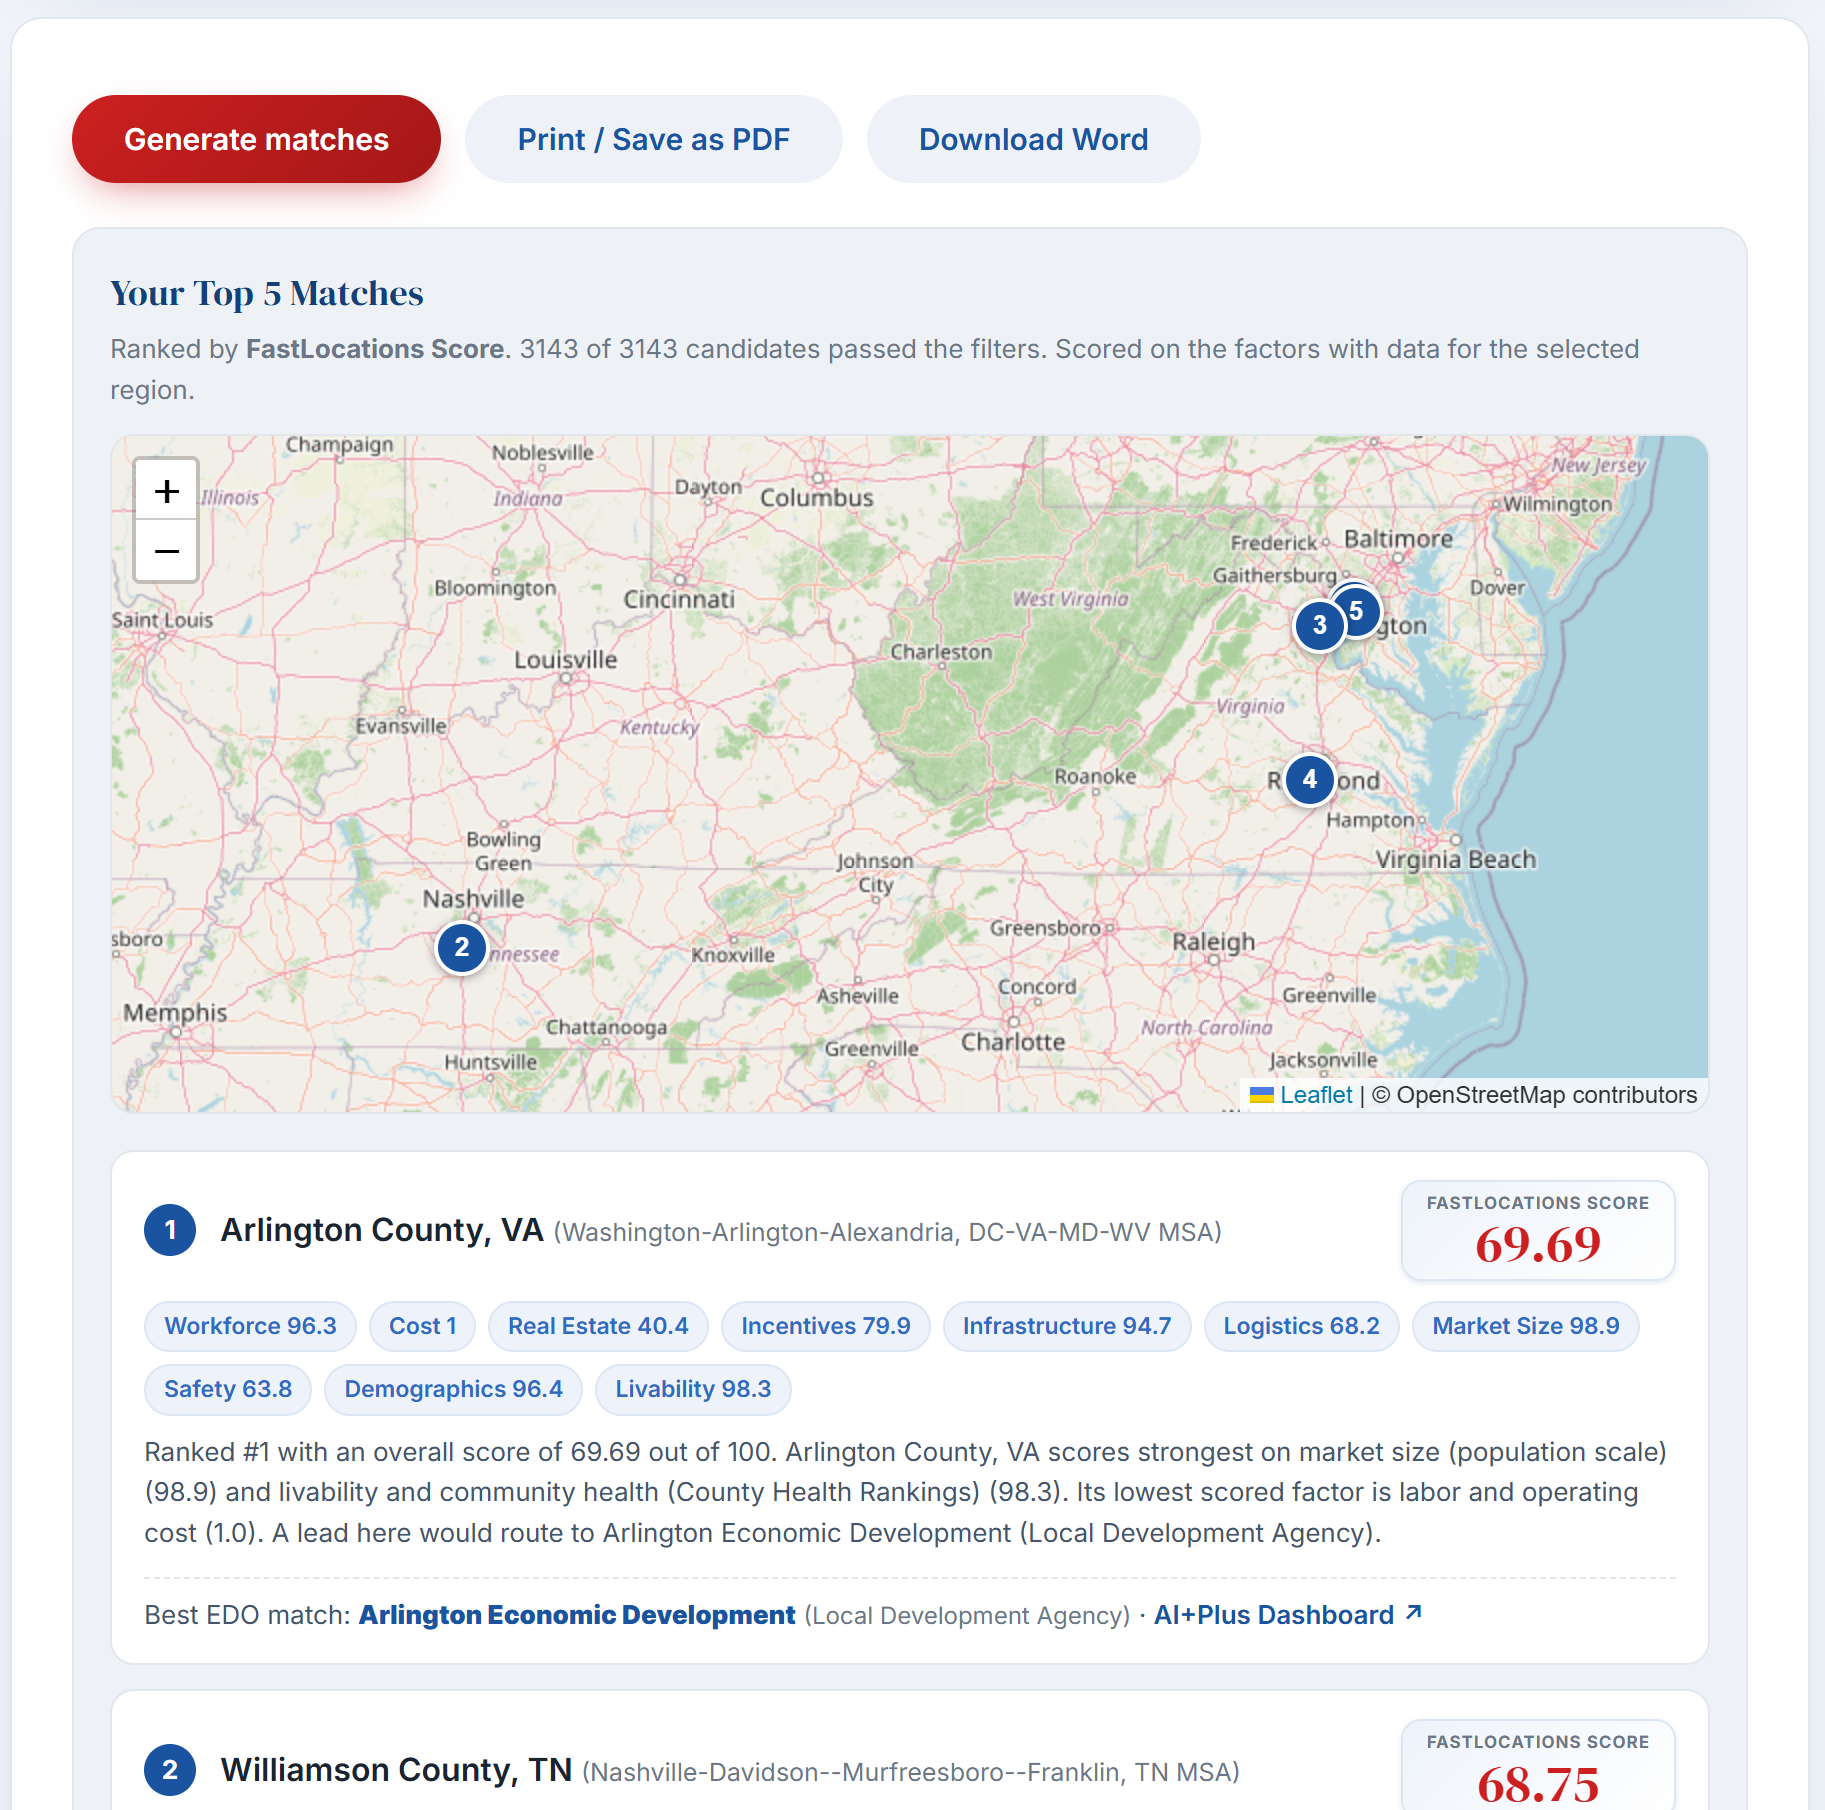
My Project captures project parameters — CapEx, hiring headcount, wage targets, utility demands, and logistic constraints — to run automated multi-factor scoring against North American markets. It returns the five strongest matches, each with a FastLocations Score and the reasoning behind it.
Your project details remain strictly confidential and are never shared with any organization.
Project Profile Scaffolding
Establish baseline parameters to standardize research and inform conversations with regional economic development agencies.
Scoring & Matching Engine
The algorithm compares inputs against demographic, real estate, infrastructure, and incentive datasets to generate ranked location recommendations.
Pro tip: Complete your project intake before engaging assistants to ensure all project criteria are consistently applied.
Handoff
From when to where, without retyping
If you ran Stay or Grow first and the answer points somewhere other than your current site, the report offers a Find where, in My Project button. It carries what the diagnostic already knows into this form so you are not entering the same figures twice.
What Carries Across
Use type and NAICS, the recommended facility type, indicative square footage and headcount, shift pattern, peak power demand, and your decision-by and operational-by dates — plus a plain-text summary of the verdict.
What Stays Blank
Geography, incentives, factor weights, acreage and water volumes are left empty on purpose — those are exactly the questions My Project exists to ask. A banner lists every field that was prefilled so you know what to check.
Nothing is submitted automatically. The prefill travels in your own browser's storage — never in a URL — and expires after seven days. Generate matches is still your click.
Both the Stay or Grow report and My Project can also produce a draft Strategic Expansion Plan as a Word document — executive summary, the runway table, options considered, requirements for the next site, candidate locations with EDO contacts and dashboard links, a dated timeline, and assumptions and risks. Anything the tools do not know appears as a bracketed placeholder, so the draft is honest about what still needs deciding.
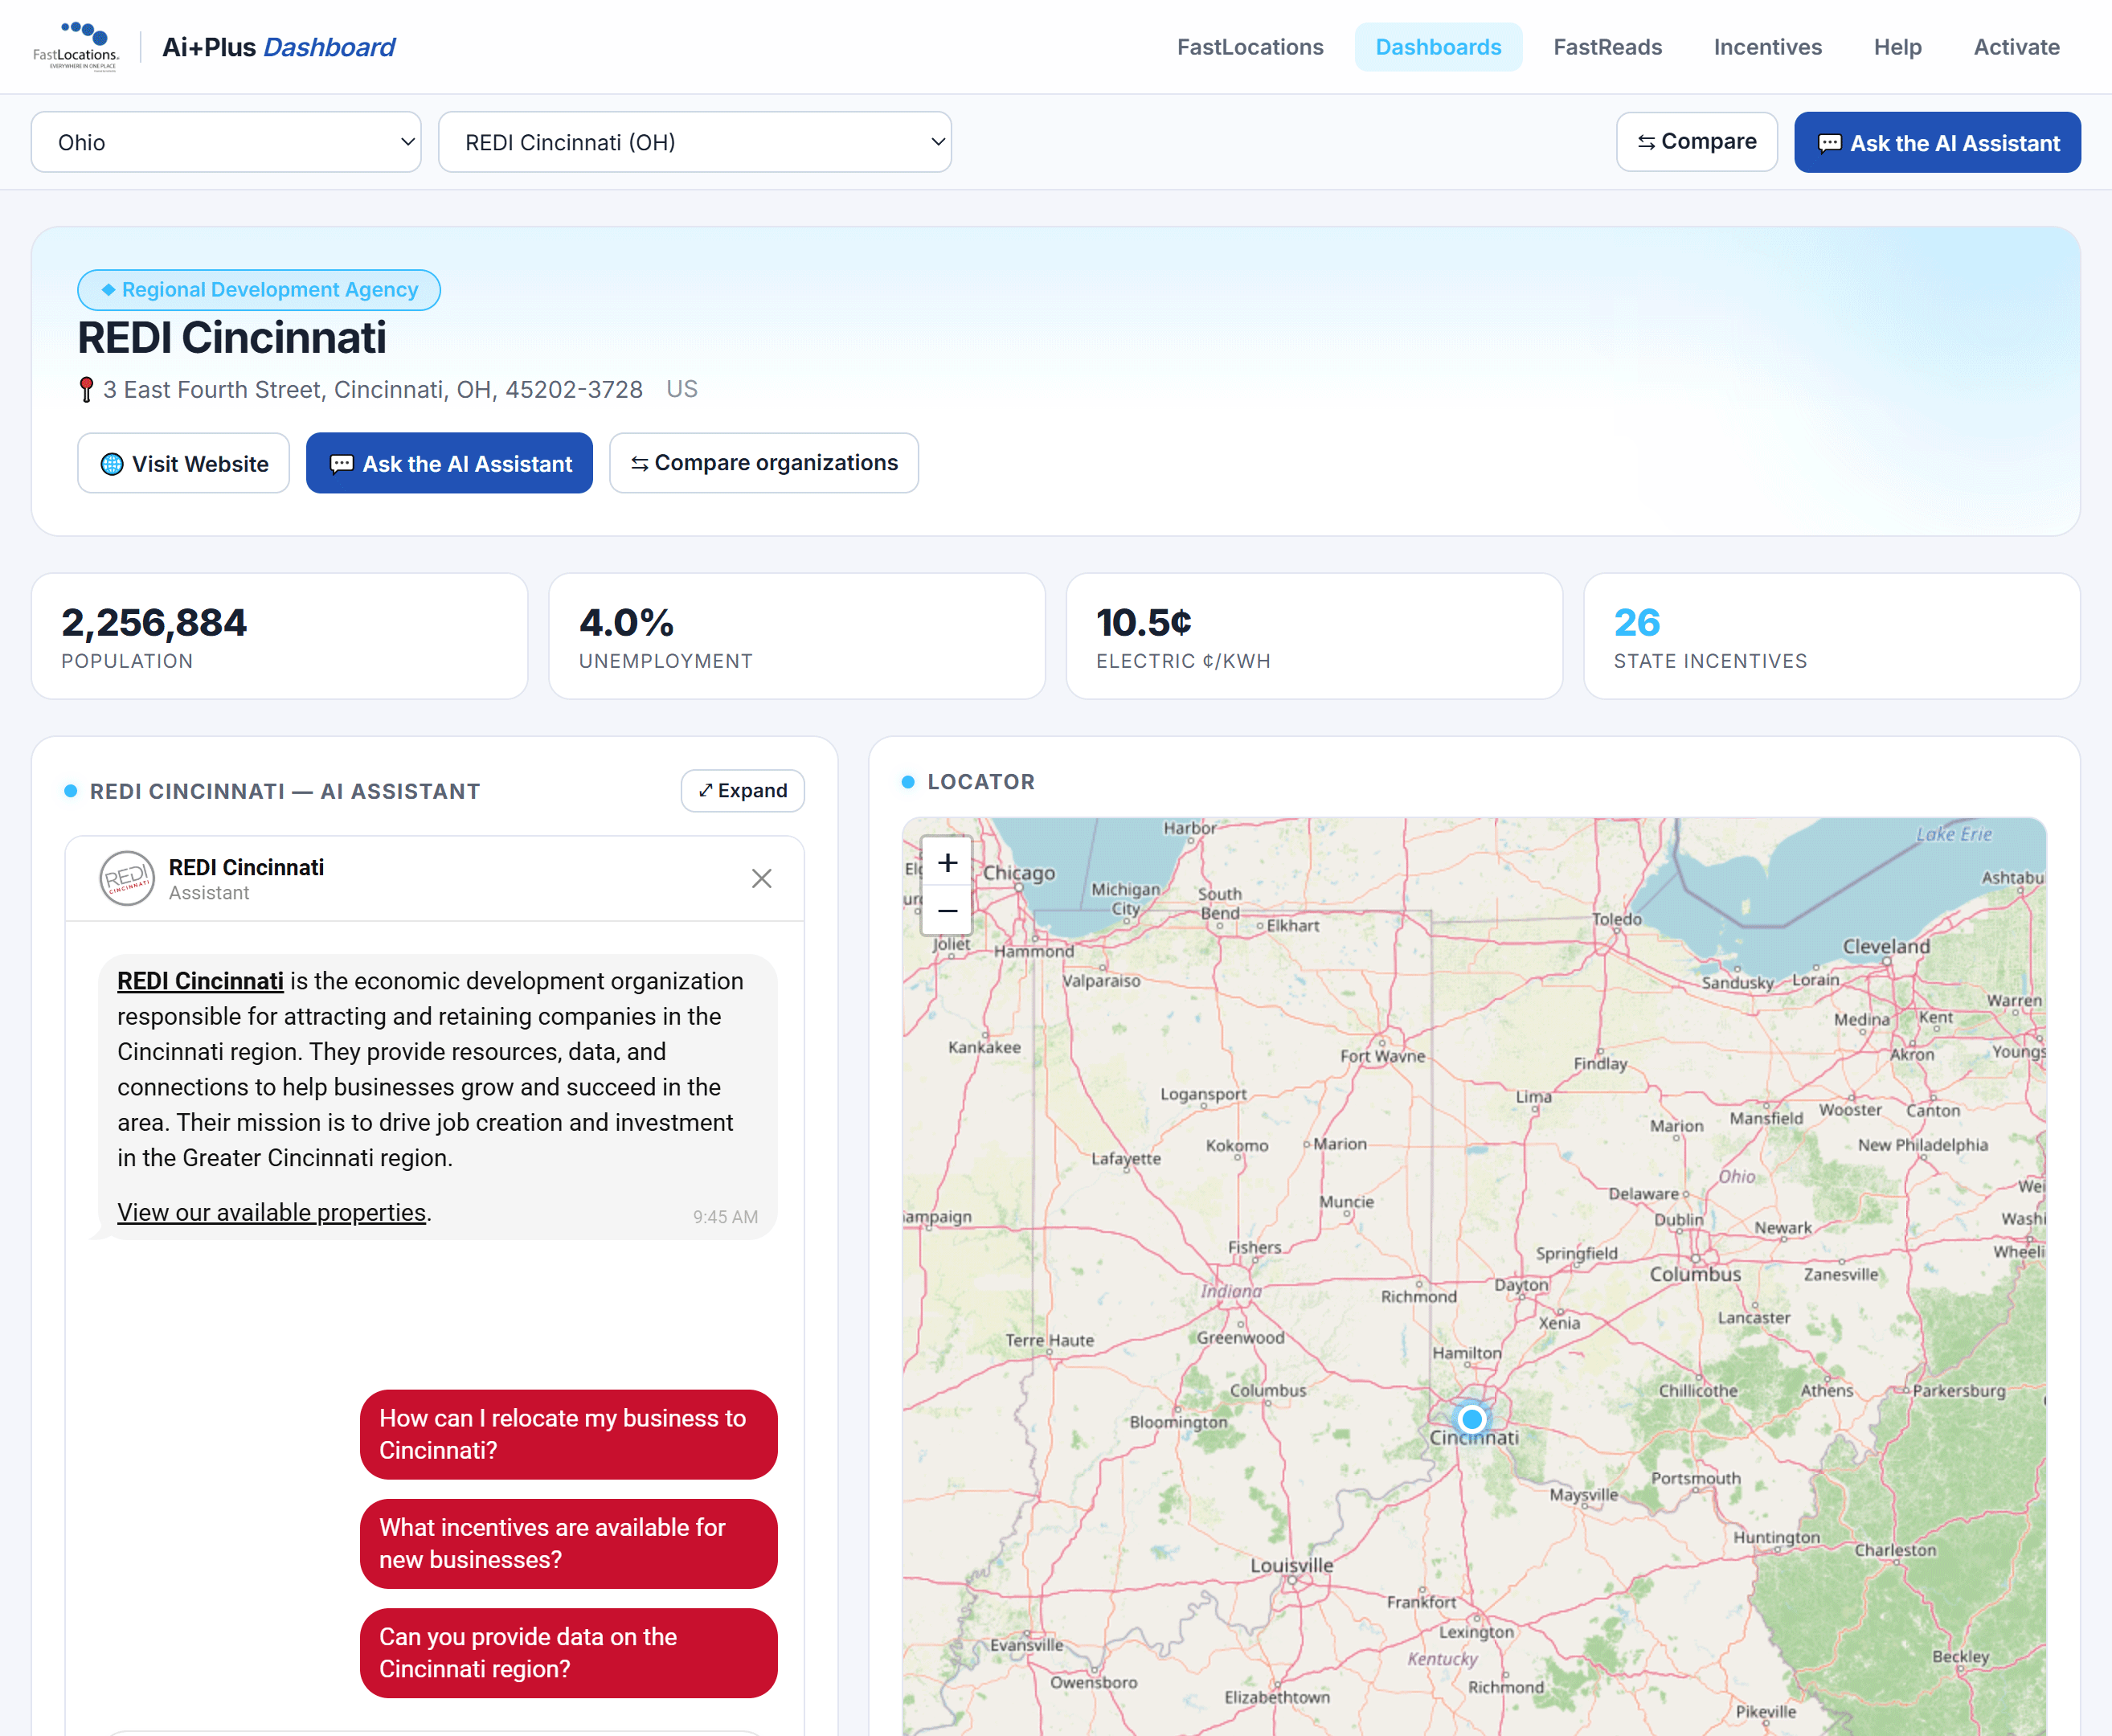
Every Economic Development Agency on the FastLocations map has an Ai+Plus Dashboard — a comprehensive, data-rich profile page that goes well beyond the AI chat. Once you've selected an agency, the dashboard gives you a structured snapshot of the region across workforce, economics, housing, education, incentives, and more.
Use the Dashboard Locator to find and open a dashboard by state and organization, or jump straight to an example to see what's available.
At-a-Glance Key Stats
The top of each dashboard surfaces the region's most critical site-selection metrics: total population, unemployment rate, average commercial electricity cost (¢/kWh), and a count of available state incentive programs — each with its five-year movement, so you see the direction as well as the level.
Integrated AI Assistant
The dashboard includes a live AI Assistant panel pre-loaded with the selected agency's knowledge. Suggested prompts are built in — or type your own question to receive tailored regional intelligence.
Workforce & Education
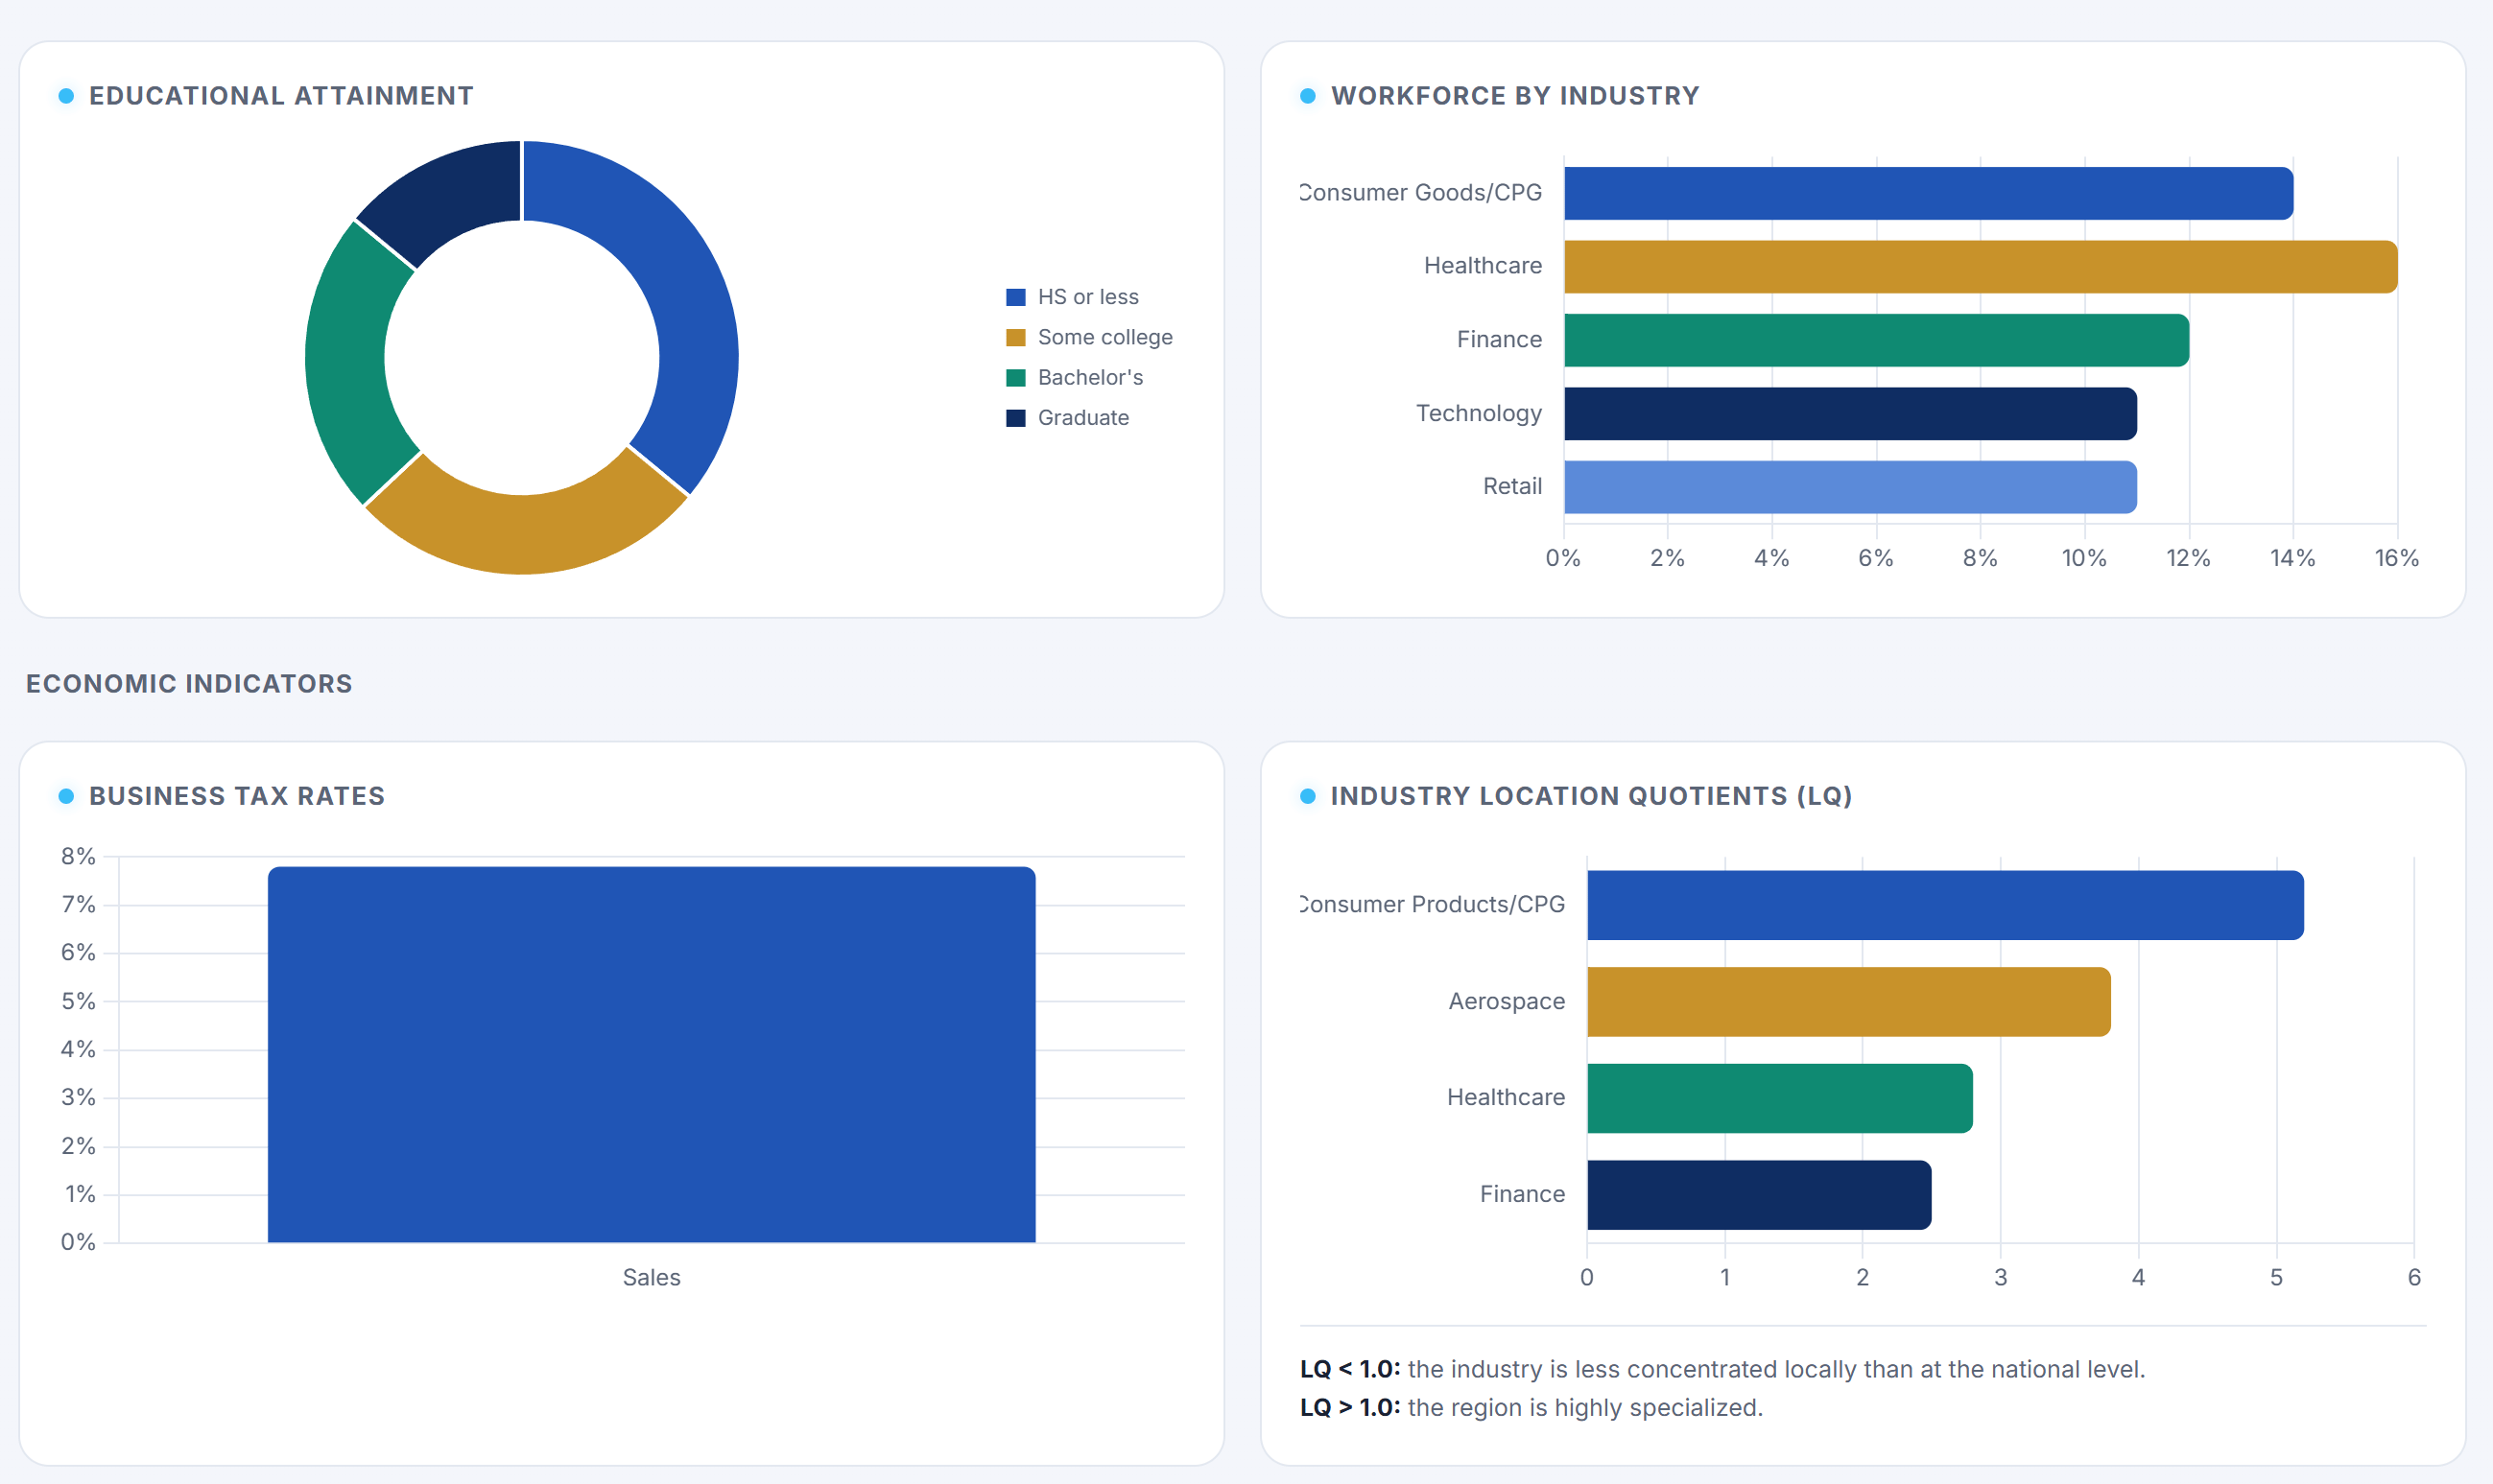
Charts covering educational attainment, workforce concentration by industry, and Industry Location Quotients (LQ) show how well the regional labor pool aligns with your sector.
Economic Indicators
Business tax rate comparisons, housing market metrics, average permitting timelines, major employer lists, and nearby post-secondary institutions round out the regional picture.
Five-Year Trends
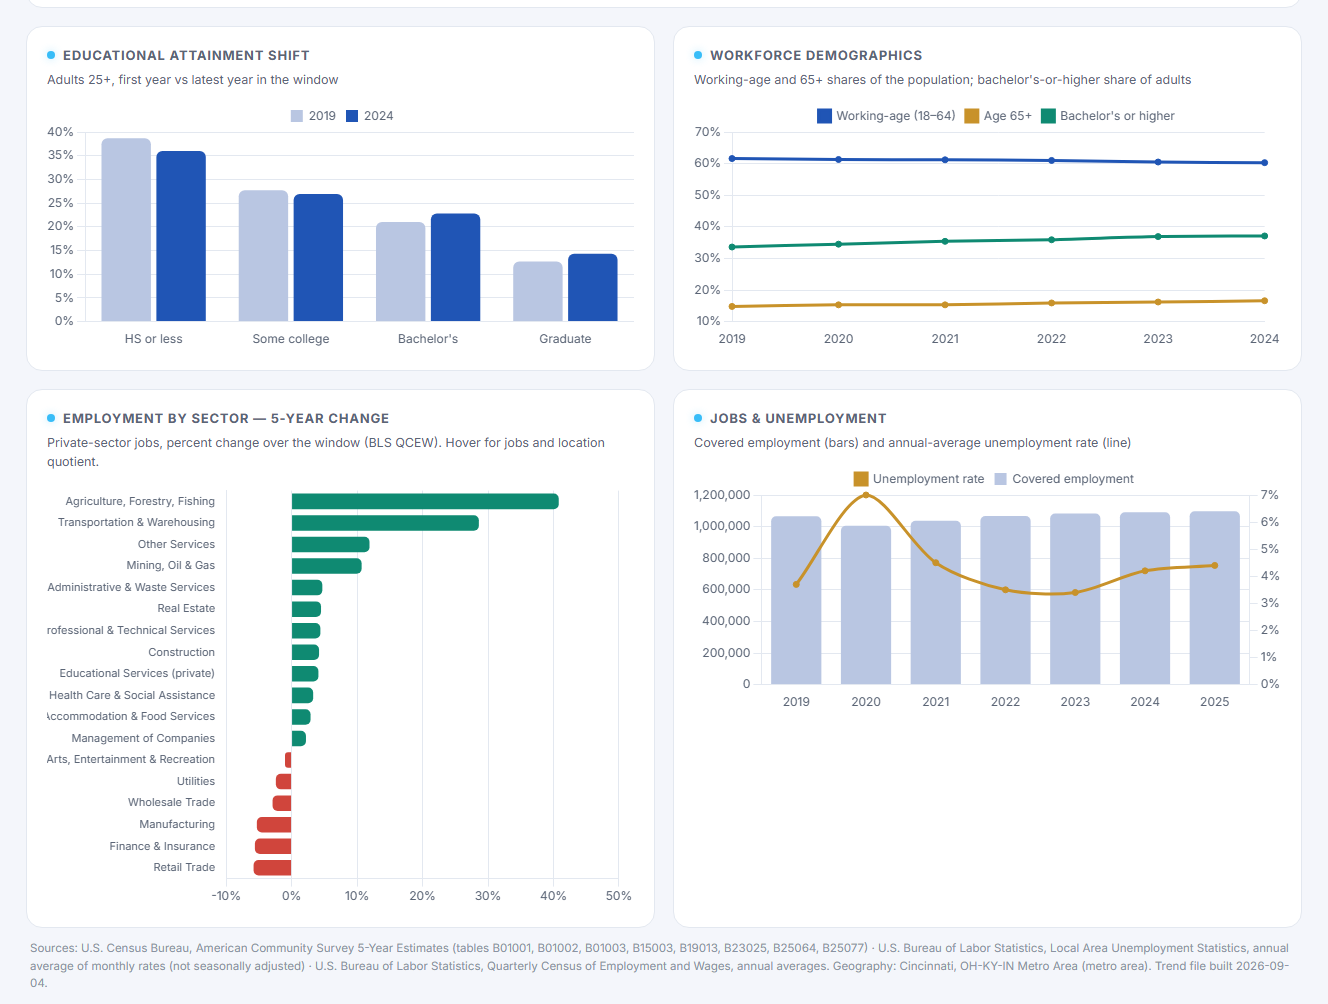
A trend block tracks the region over a rolling five-year window: how educational attainment has shifted, working-age and 65+ population shares, private-sector job change by industry, and covered employment against the annual-average unemployment rate. Every chart names its source and vintage.
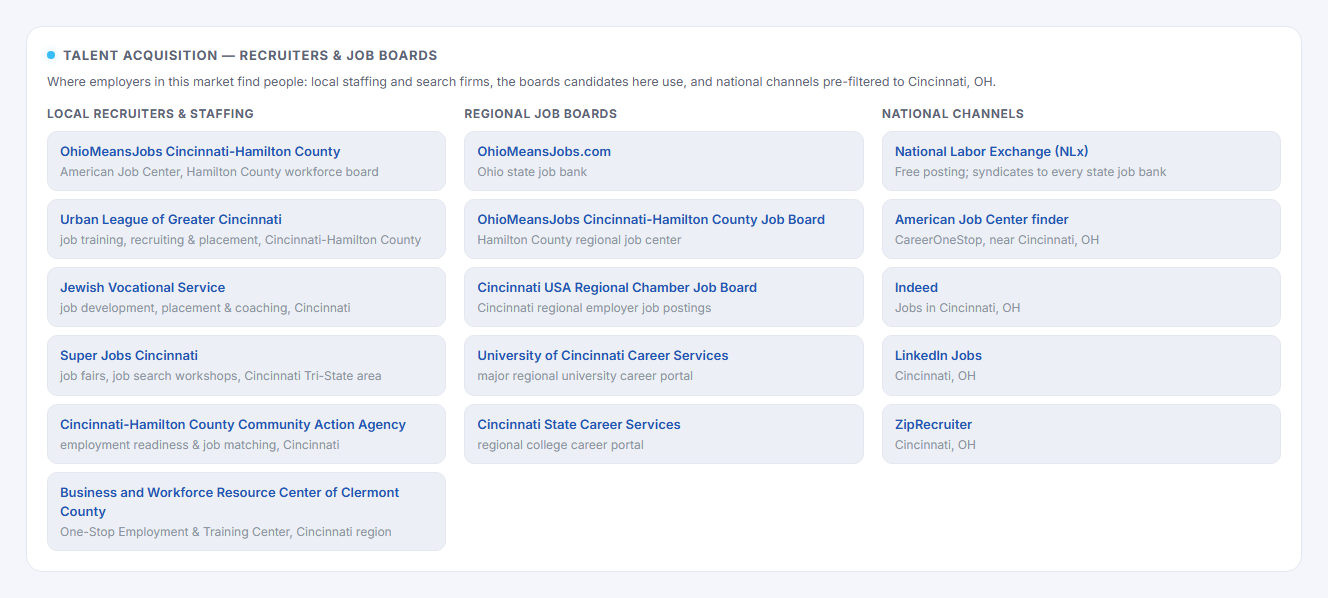
Talent Acquisition
Where employers in that market actually find people — local staffing and search firms, the regional job boards candidates use, and national channels pre-filtered to the metro. Useful the moment a hiring plan turns into a recruiting plan.
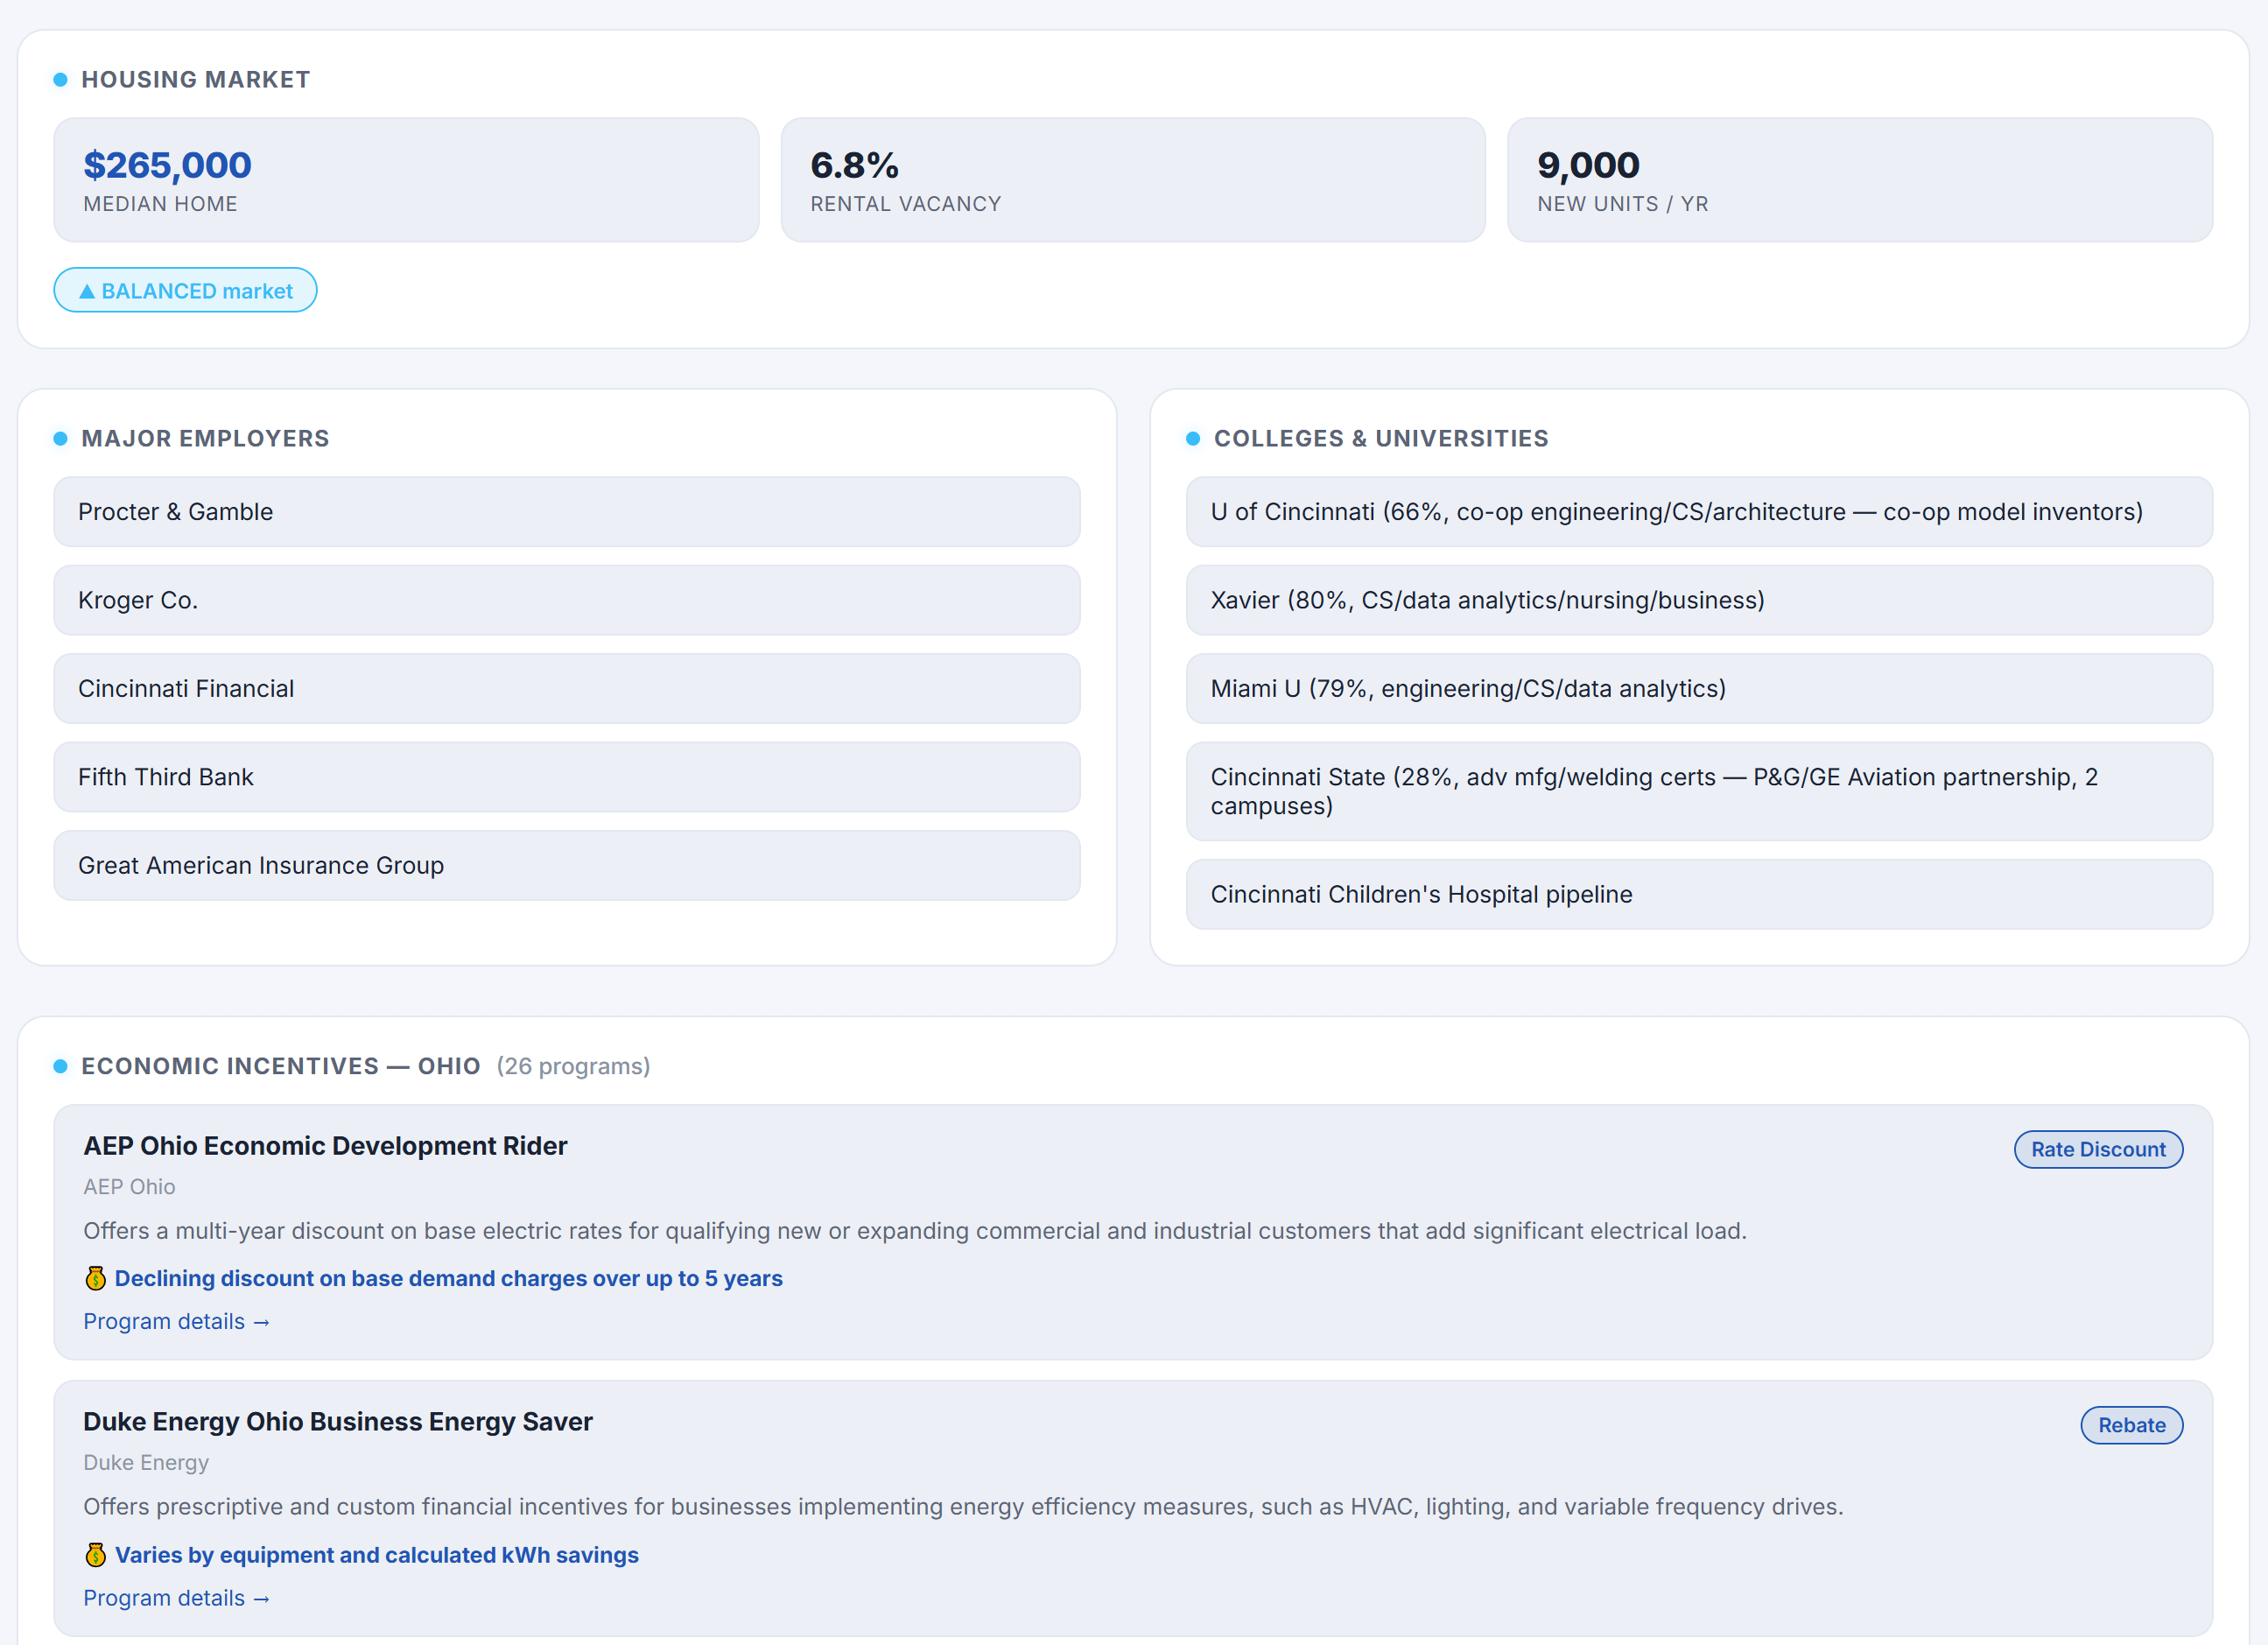
Pro tip: Open the Dashboard alongside the map to view regional data and chat with the AI Assistant simultaneously. Use the Economic Incentives section at the bottom to identify programs before asking for specific qualification criteria.
Compare
Side-by-side market comparisons
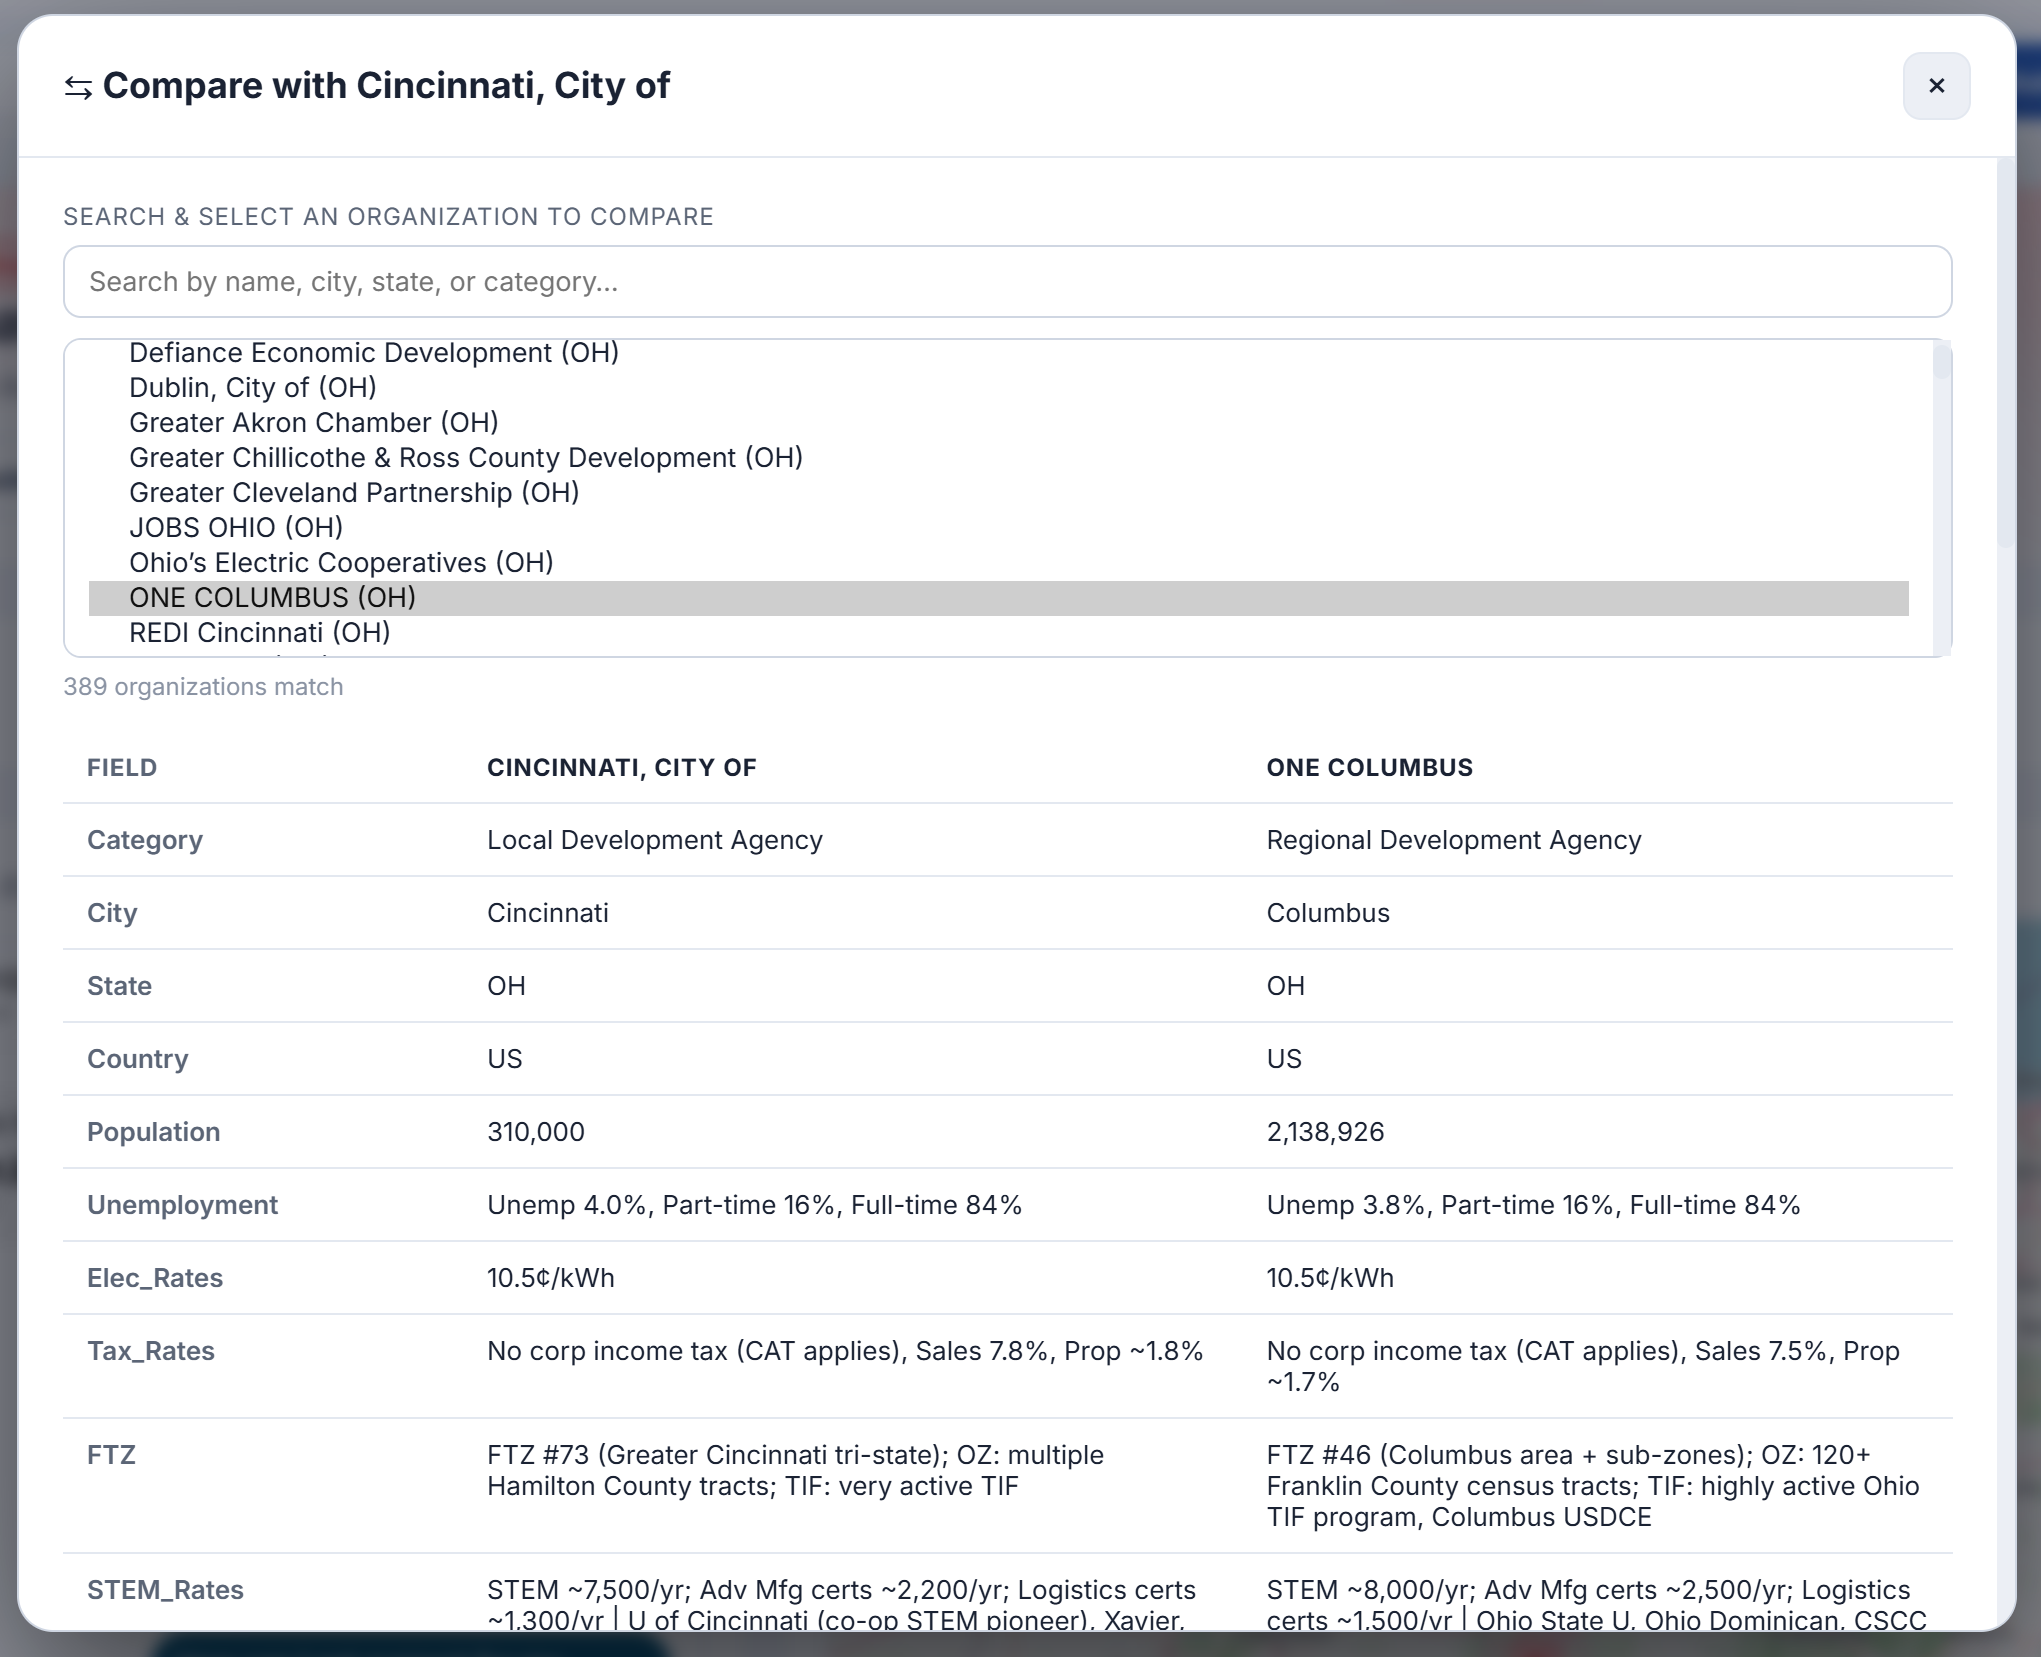
Every dashboard includes a Compare button that opens a side-by-side analysis panel. Search across all organizations by name, city, state, or category and select one to compare against the current region instantly.
Search Any Organization
Filter by name, city, state, or agency category across the entire database to find your comparison target quickly.
Key Comparison Fields
Population, unemployment rate, electric rates, business tax structure, FTZ & Opportunity Zone status, TIF activity, and STEM credential output.
Pro tip: Use Compare early in a shortlist review — open the dashboard for your leading market, then compare it directly against alternative locations without jumping between tabs.
The AI +Plus assistants in FastLocations are trained on real regional data — but the quality of the answer depends on the context you provide. A well-crafted prompt gives the assistant the parameters it needs to deliver immediate, actionable intelligence.
Be Specific About Your Project
Include your key project parameters upfront: investment size, headcount, industry sector, and site requirements like acreage, clear height, rail access, or utility loads.
Bundle Your Questions
Combine related queries into a single prompt — for example, asking about available sites, workforce supply, and relevant incentive programs together.
Ask for Comparisons
Request side-by-side trade-offs between markets, power utilities, or labor profiles directly in chat.
Follow Up and Refine
Start broad and drill into specific programs or requirements. The assistant retains context throughout your conversation with each expert.
Sample Prompt: Download the Site Consultant Prompt below as a baseline. Edit the bracketed terms to match your project profile before sending it to any assistant.
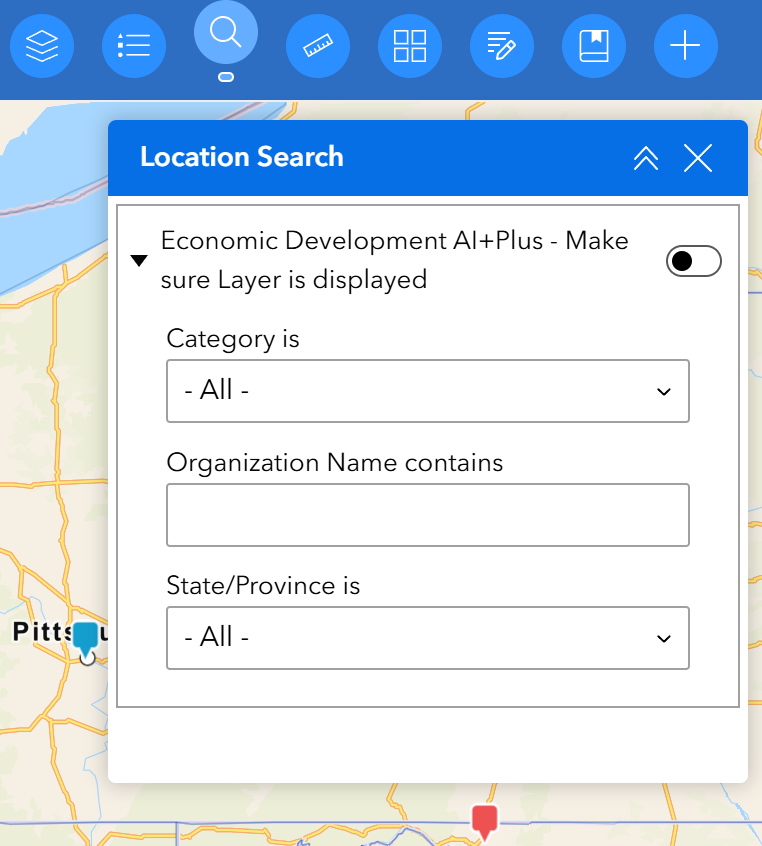
The Location Search tool — located in the top toolbar — lets you filter which Economic Development agencies appear on the map, narrowing the view to your target organization type or geography.
Category Filter
Filter between Local, Regional, State, Utility, and other agency types to focus on specific organizational tiers.
Organization Name
Type any part of an agency's name to zoom directly to their map location and activate their knowledge base.
State / Province Filter
Limit the map display to a single state or province to view all active development agencies in a target market.
Layer Toggle
Confirm the Economic Development AI+Plus layer is active if agency markers are not visible.
Pro tip: Filter by State first, then refine by Category to isolate the agencies most relevant to your search.
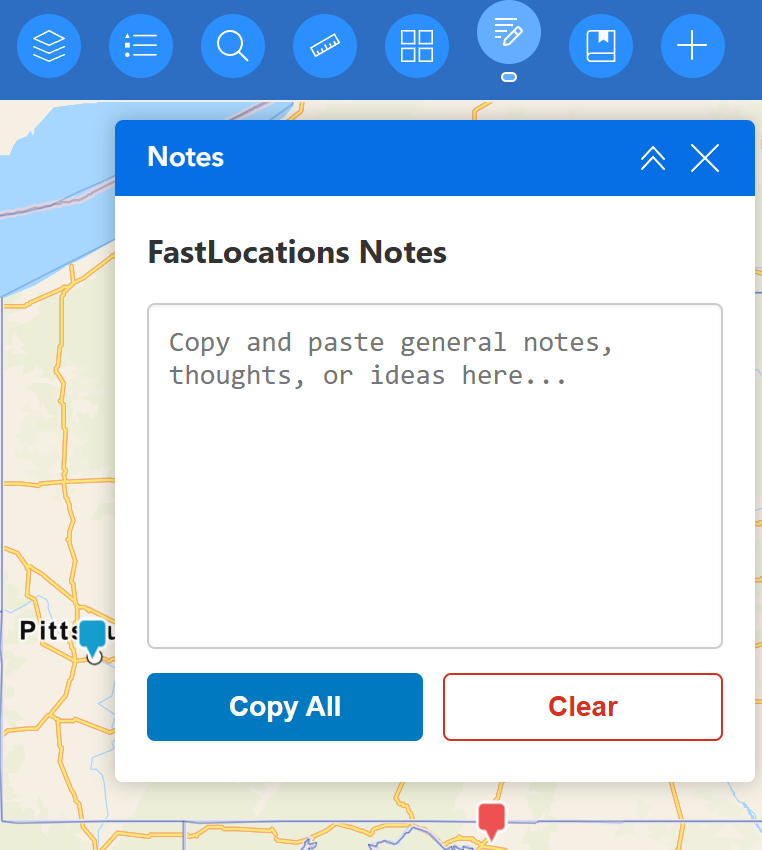
The Notes tool gives you a persistent scratch pad that stays open while exploring. Access it from the pencil icon in the toolbar to record findings, incentive terms, or follow-up questions.
Copy & Paste Freely
Paste text from chat, demographic tables, or properties. Notes remain saved when switching between experts.
Copy All
Copy the entire contents of your scratch pad to your clipboard in one click to export into external reports.
Pro tip: Paste key assistant responses directly into Notes to assemble a preliminary site-brief as you navigate.
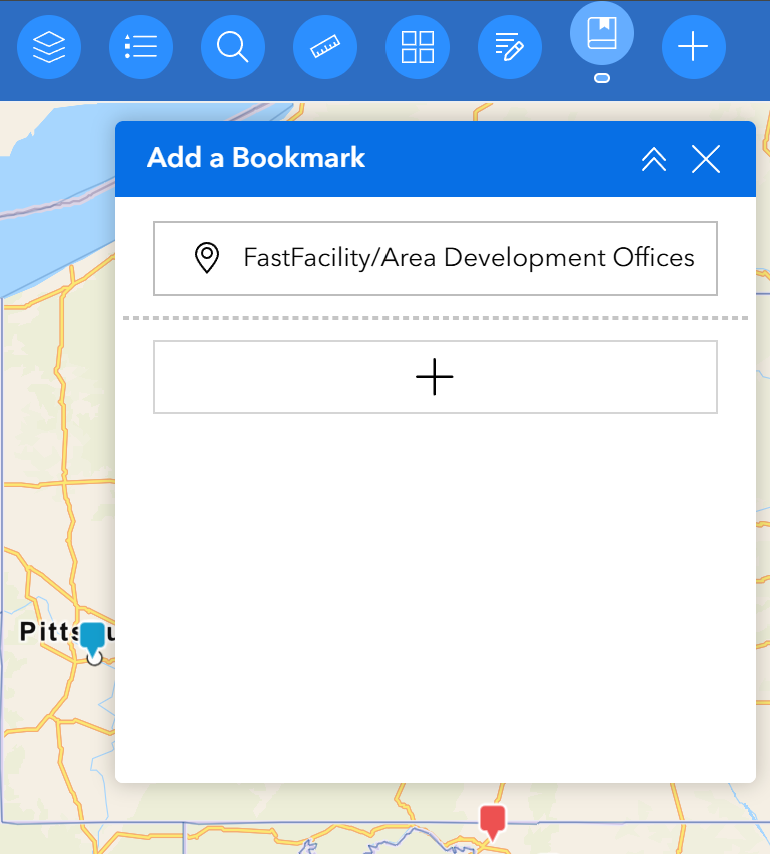
Bookmarks let you save snapshots of your map camera position — zoom level, center point, and visible layers — to toggle between locations instantly.
Named Locations
Assign descriptive labels to candidate regions and sites to navigate between them quickly during evaluation.
Instant Return
Jump between multiple shortlisted candidate markets without having to manually pan and zoom each time.
Pro tip: Save bookmarks for each shortlisted market prior to client presentations to maintain smooth navigation.
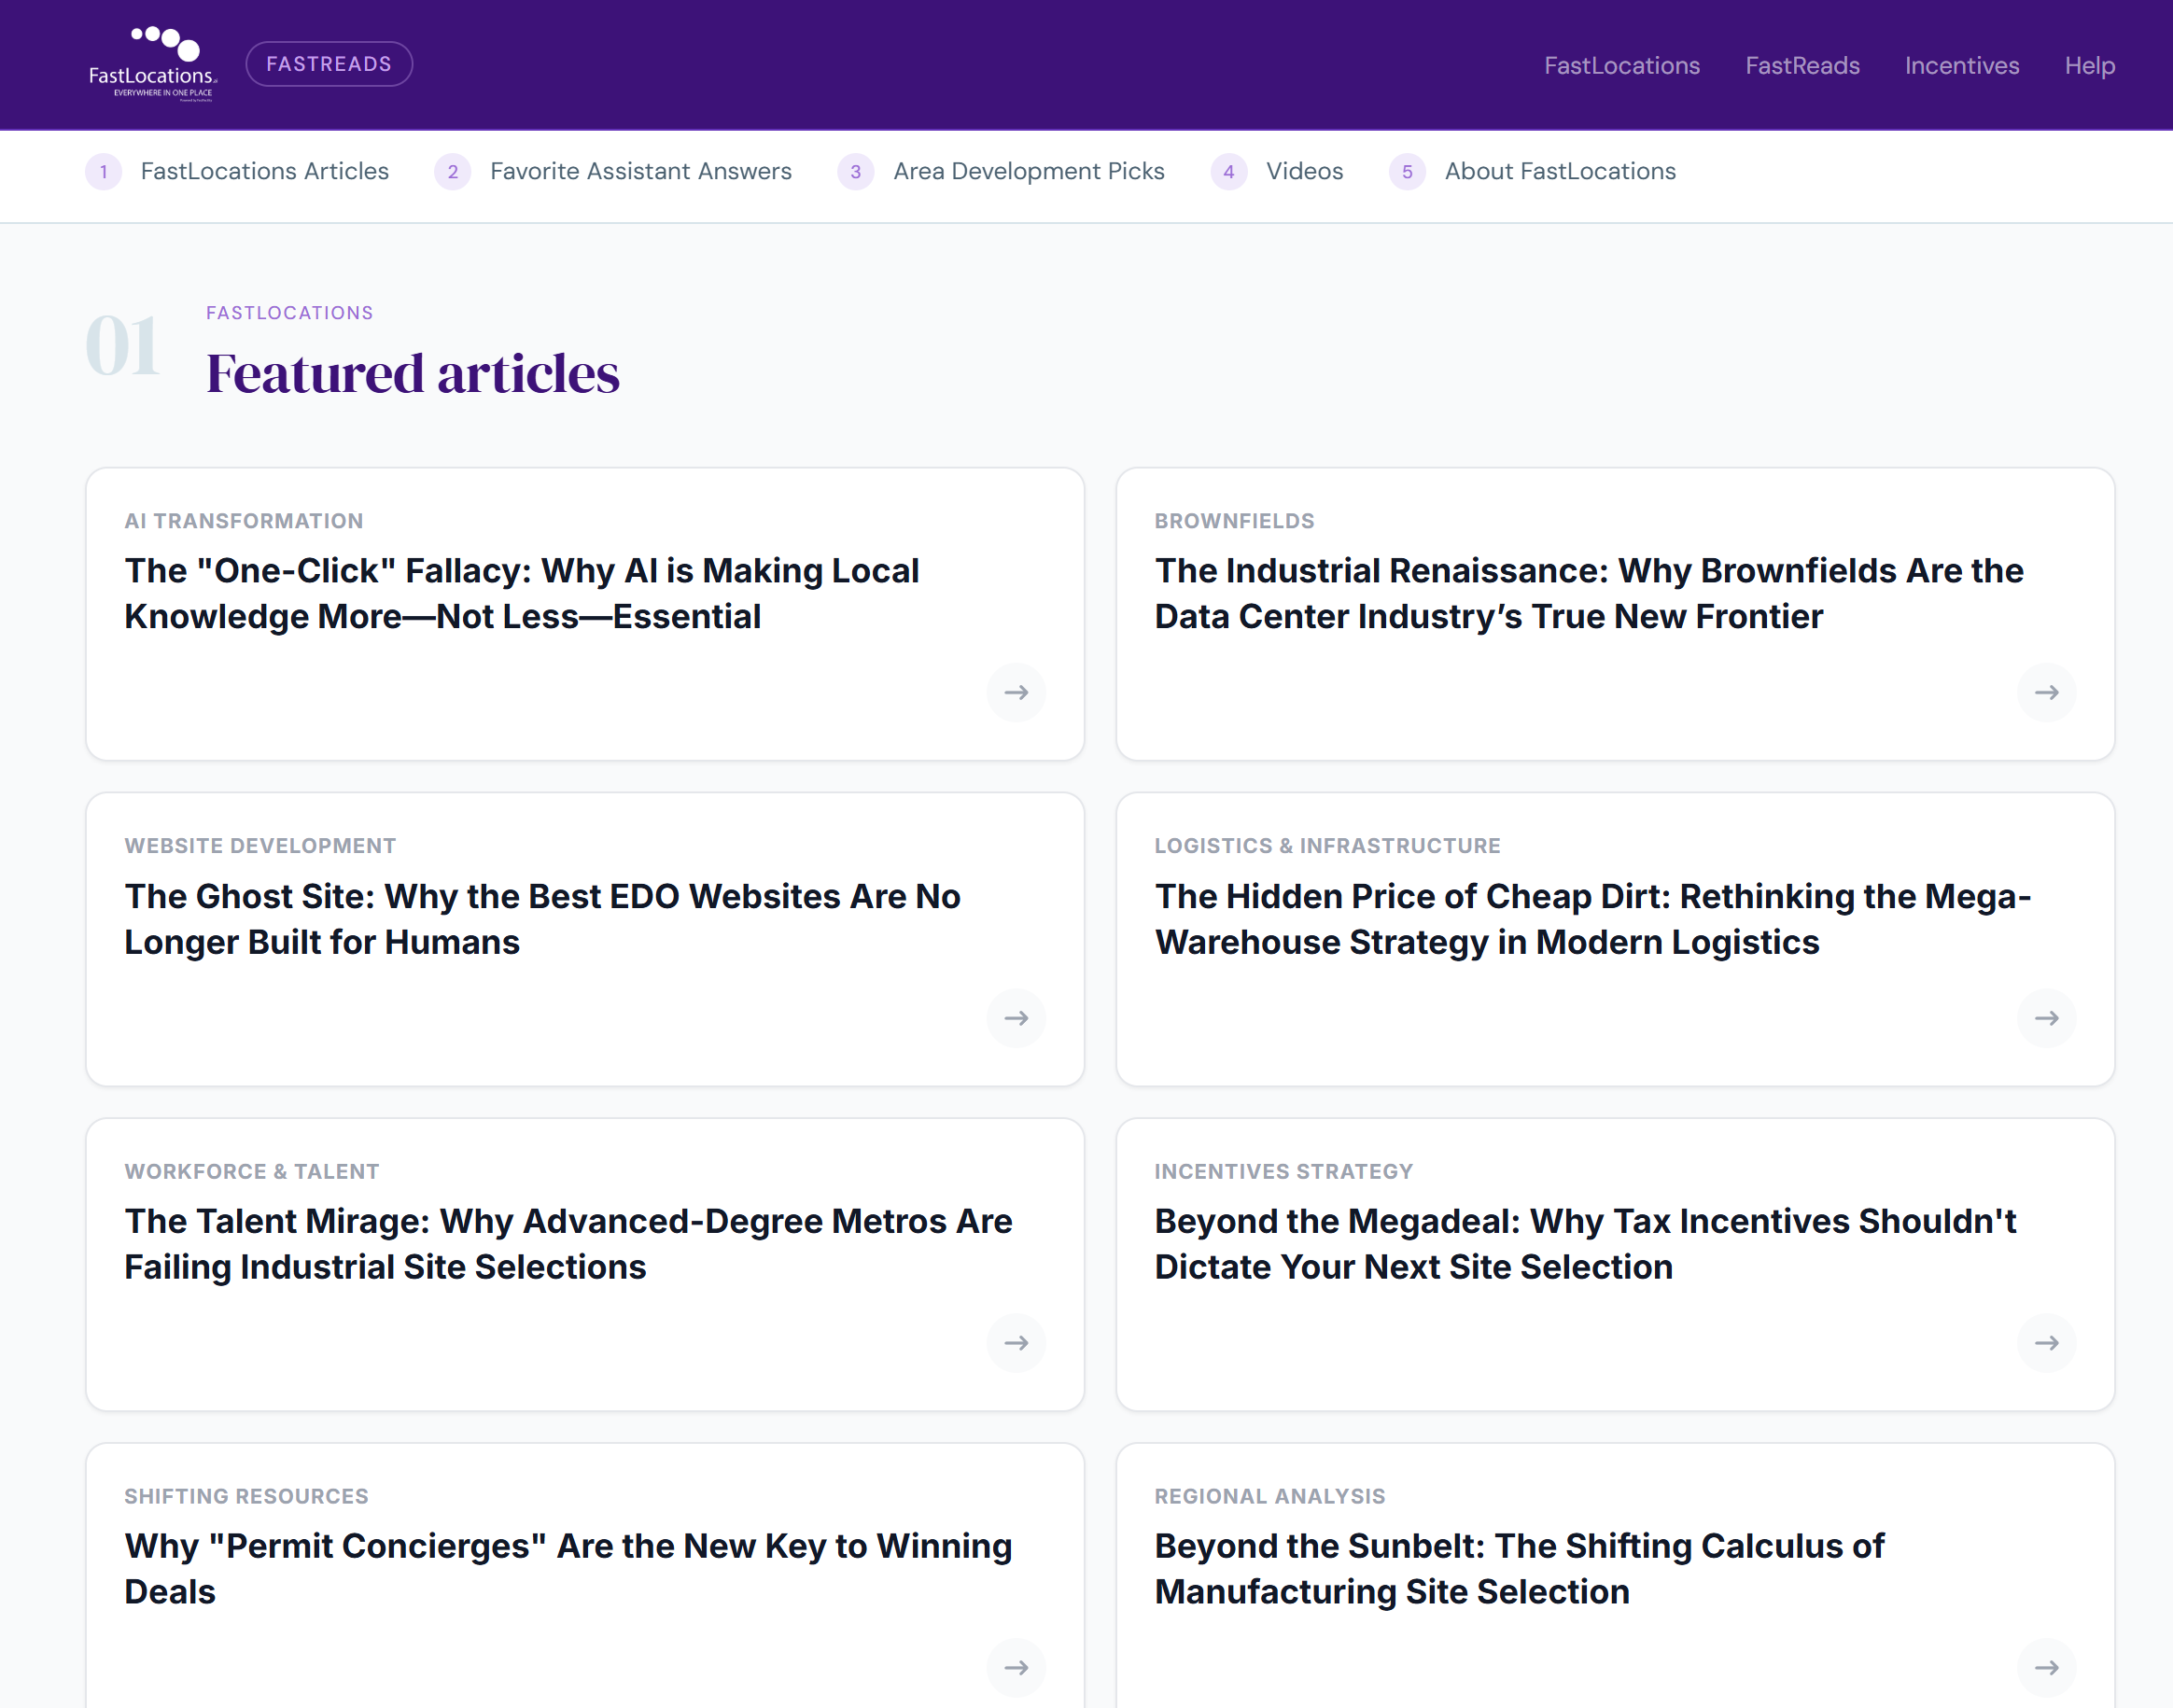
FastReads provide state-level intelligence briefings covering business climate, labor assets, infrastructure highlights, and key industries in concise narrative formats.
Curated Regional Intelligence
Structured around business tax environments, major industry clusters, workforce pipelines, and utility infrastructure.
Articles & Resources
Editorial perspective and industry analysis from Area Development providing narrative context behind the data.
Pro tip: Read state FastReads before engaging with local agency assistants to prime your prompts with relevant regional terminology.
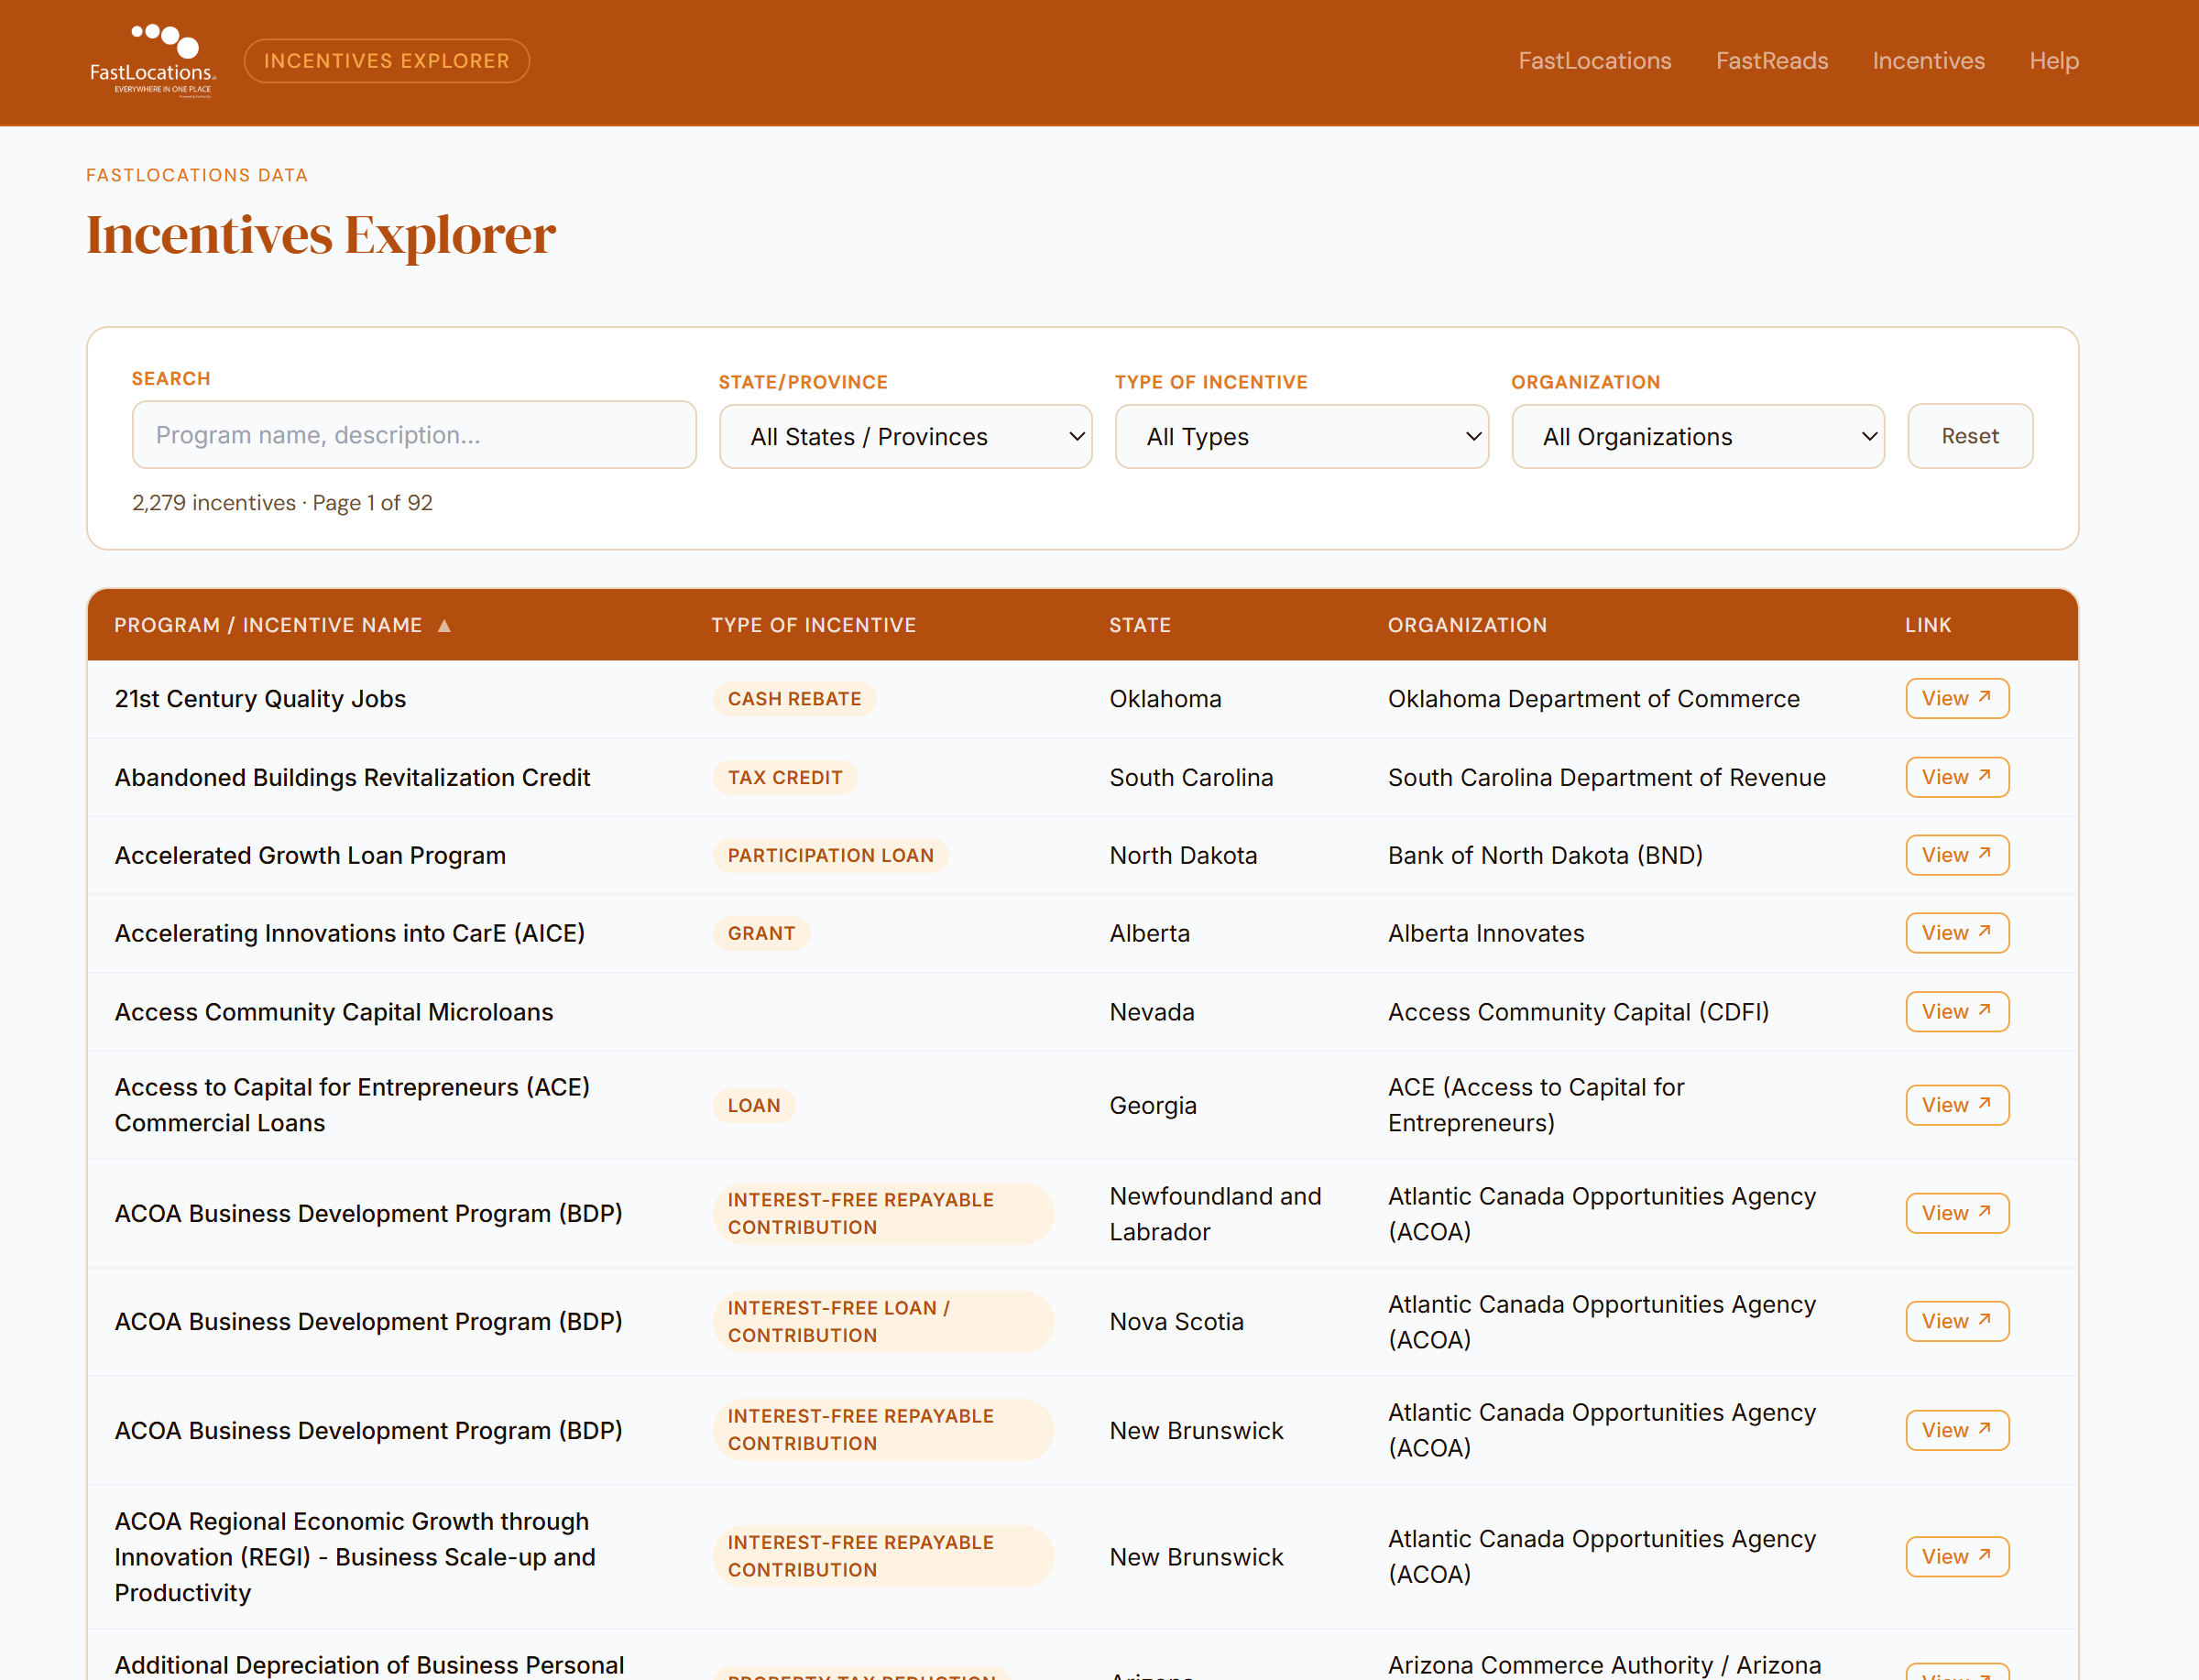
The Incentives Explorer is a searchable database of economic development incentive programs spanning grants, tax credits, abatements, and low-interest loans.
Comprehensive Program Database
Covers discretionary cash grants, statutory tax credits, abatements, training funds, and utility rate assistance across North America.
Multi-Parameter Filtering
Filter programs by keyword, jurisdiction, incentive structure, and administering organization with direct links to official filings.
Pro tip: Identify specific incentive program titles in the Explorer, then ask the AI assistant to analyze statutory eligibility for your project parameters.
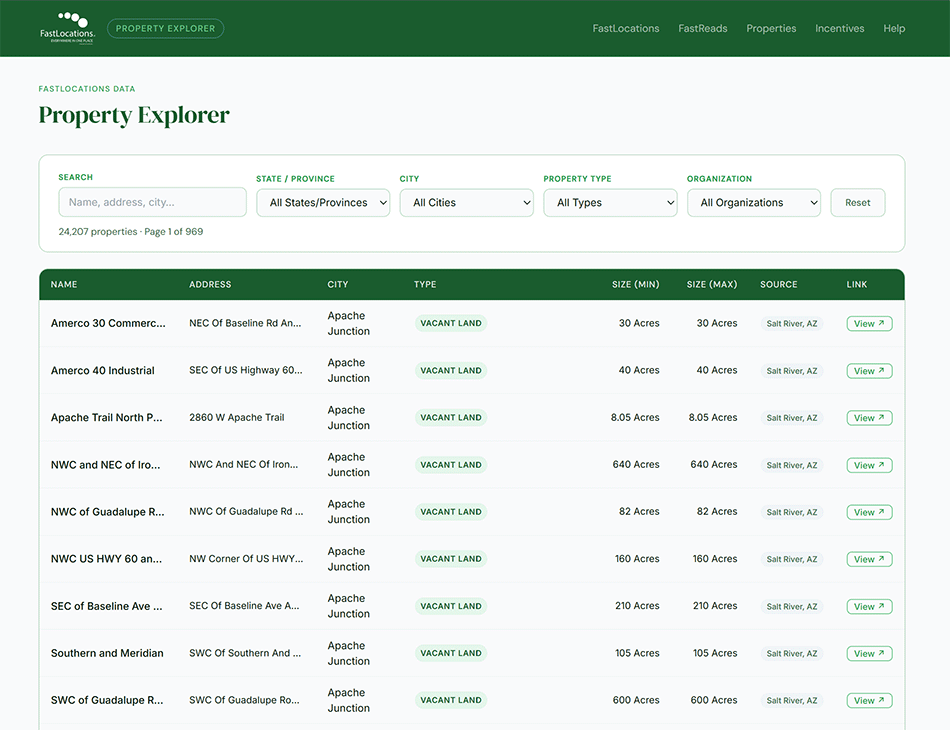
The Property Explorer aggregates verified commercial, industrial, and development site listings directly from participating Economic Development Organizations.
Requirement-Based Search
Filter listings by building square footage, site acreage, ceiling clear height, and asset class.
EDO-Verified Listings
Listings sourced from regional economic agencies often include utility capacity, zoning status, and local incentive eligibility.
Pro tip: Identify candidate sites in the Property Explorer and query the corresponding EDO assistant for local zoning approval timelines and infrastructure capacities.
Selecting an agency icon resets the Assistant's active knowledge base to that specific organization.
Important: Switching agencies archives previous chat history to avoid cross-contaminating regional context.
Confirming Selection
The panel header displays the active agency assistant name. If responses seem non-specific, verify the marker is selected on the map.
Handoff Animation
On touch devices, tap the marker icon directly and allow the interface panel to update before submitting prompts.